• On Thursday, the GBPY/JPY snapped two days of losses, though faltered to crack the 20-day EMA.
  • GBP/JPY: Break above 162.00 could pave the way toward the YTD high at 168.73; otherwise, a fall towards 161.00 is on the cards.


The GBP/JPY pares some of its Wednesday’s losses on Thursday, edged higher by 0.23%, despite a dismal market sentiment hitting the financial markets. Expectations of further Fed aggression, alongside China’s weaker than expected factory activity, was no excuse for GBP bulls to cap their weekly losses, reclaiming the 161.00 mark. At the time of writing, the GBP/JPY is trading at 161.79, slightly below its opening price, as the Asian session begins.

GBP/JPY Price Analysis: Technical outlook

From a technical perspective, the GBP/JPY remains sideways. The cross-currency remains in the 159.44-162.84 range, unable to crack above/below it due to fundamental reasons linked to both currencies. The Relative Strength Index (RSI) paints a dull picture, trapped in the 38-49 reading, in bearish territory, directionless. Therefore, GBP/JPY intraday price action could be more entertaining.

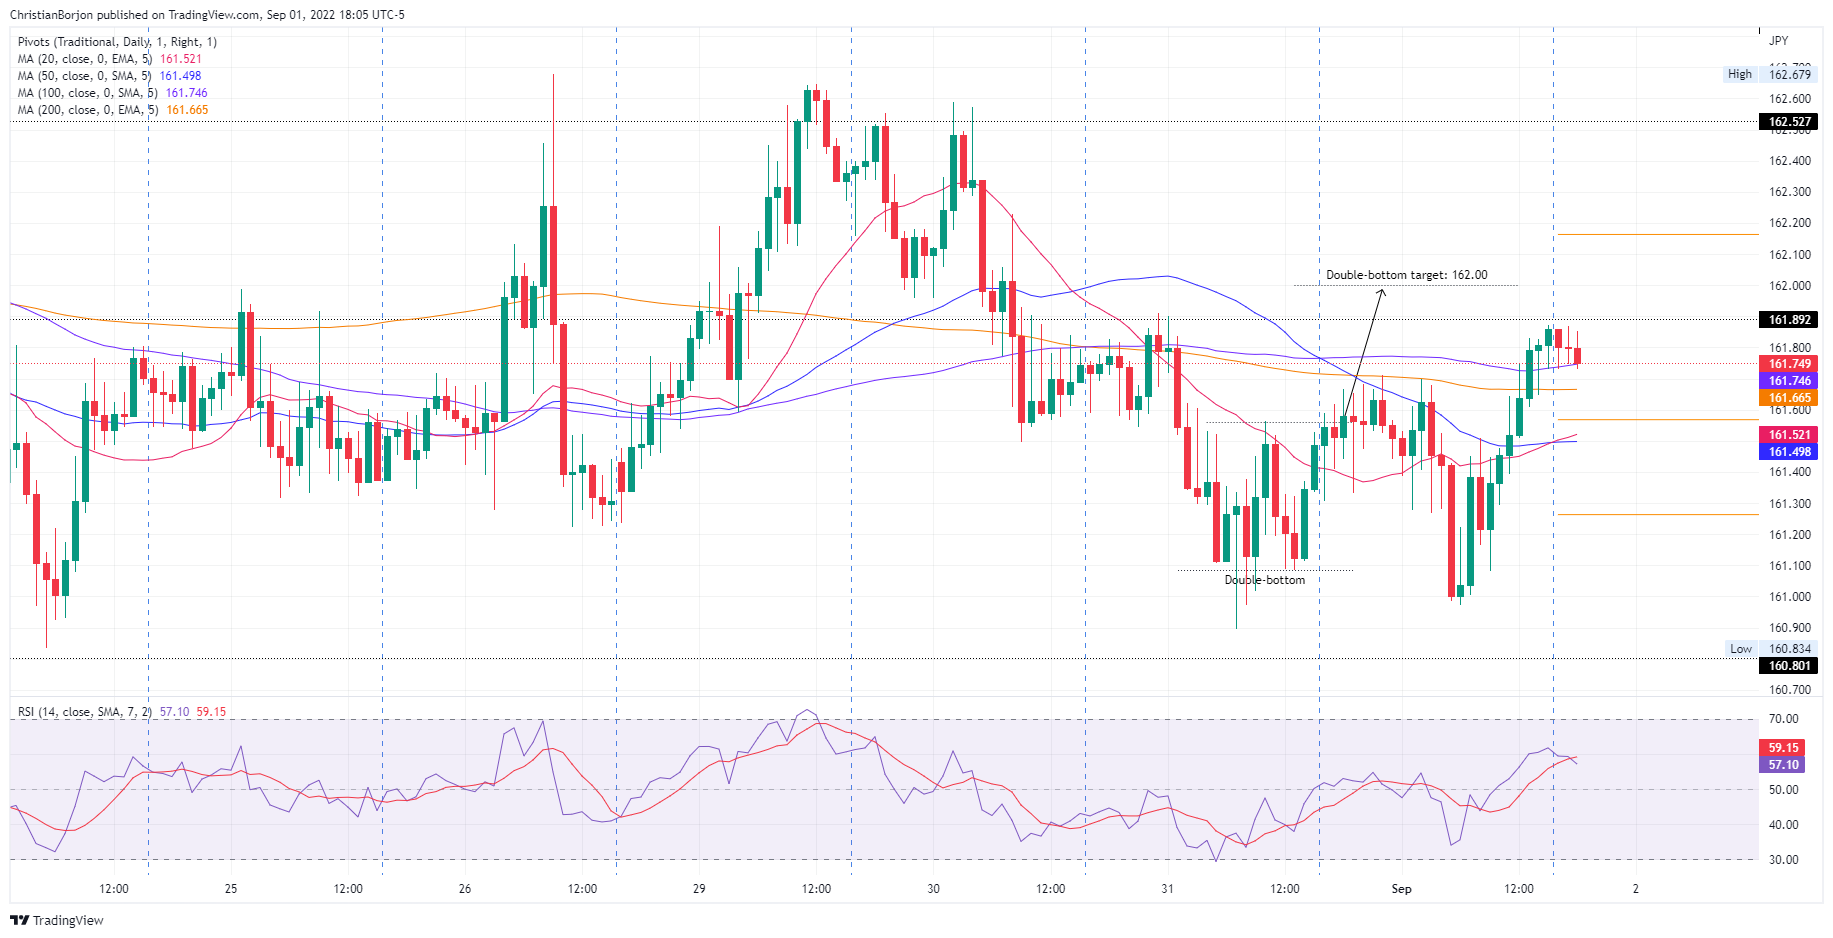
Short term, the GBP/JPY one-hour chart illustrates the formation of a double-bottom on Wednesday, which targets the 162.00 mark. Nevertheless, buyers’ failure to reach the target spurred a pullback towards the 161.70s area.

Therefore, the GBP/JPY’s first resistance would be the September 1 daily high at 161.87. The break above will expose the double bottom’s 162.00 targets. On the flip side, the GBP/JPY first support would be the 100-EMA at 161.74. A breach of the latter would pave the way towards the bottom of the range, but firstly, sellers need to reclaim the 200-EMA at 161.66, followed by the confluence of the 20 and 50-EMAs around 161.49-53.

GBP/JPY Key Technical Levels

GBP/JPY

Overview
Today last price 161.72
Today Daily Change 0.29
Today Daily Change % 0.18
Today daily open 161.51
 
Trends
Daily SMA20 162.09
Daily SMA50 163.3
Daily SMA100 163.06
Daily SMA200 159.23
 
Levels
Previous Daily High 161.91
Previous Daily Low 160.9
Previous Weekly High 162.69
Previous Weekly Low 160.8
Previous Monthly High 163.99
Previous Monthly Low 159.45
Daily Fibonacci 38.2% 161.29
Daily Fibonacci 61.8% 161.52
Daily Pivot Point S1 160.97
Daily Pivot Point S2 160.43
Daily Pivot Point S3 159.96
Daily Pivot Point R1 161.98
Daily Pivot Point R2 162.45
Daily Pivot Point R3 162.99


Share: Feed news

Information on these pages contains forward-looking statements that involve risks and uncertainties. Markets and instruments profiled on this page are for informational purposes only and should not in any way come across as a recommendation to buy or sell in these assets. You should do your own thorough research before making any investment decisions. FXStreet does not in any way guarantee that this information is free from mistakes, errors, or material misstatements. It also does not guarantee that this information is of a timely nature. Investing in Open Markets involves a great deal of risk, including the loss of all or a portion of your investment, as well as emotional distress. All risks, losses and costs associated with investing, including total loss of principal, are your responsibility. The views and opinions expressed in this article are those of the authors and do not necessarily reflect the official policy or position of FXStreet nor its advertisers. The author will not be held responsible for information that is found at the end of links posted on this page.

If not otherwise explicitly mentioned in the body of the article, at the time of writing, the author has no position in any stock mentioned in this article and no business relationship with any company mentioned. The author has not received compensation for writing this article, other than from FXStreet.

FXStreet and the author do not provide personalized recommendations. The author makes no representations as to the accuracy, completeness, or suitability of this information. FXStreet and the author will not be liable for any errors, omissions or any losses, injuries or damages arising from this information and its display or use. Errors and omissions excepted.

The author and FXStreet are not registered investment advisors and nothing in this article is intended to be investment advice.

Recommended content


Recommended content

Editors’ Picks

EUR/USD clings to daily gains above 1.0650

EUR/USD clings to daily gains above 1.0650

EUR/USD gained traction and turned positive on the day above 1.0650. The improvement seen in risk mood following the earlier flight to safety weighs on the US Dollar ahead of the weekend and helps the pair push higher.

EUR/USD News

GBP/USD recovers toward 1.2450 after UK Retail Sales data

GBP/USD recovers toward 1.2450 after UK Retail Sales data

GBP/USD reversed its direction and advanced to the 1.2450 area after touching a fresh multi-month low below 1.2400 in the Asian session. The positive shift seen in risk mood on easing fears over a deepening Iran-Israel conflict supports the pair.

GBP/USD News

Gold holds steady at around $2,380 following earlier spike

Gold holds steady at around $2,380 following earlier spike

Gold stabilized near $2,380 after spiking above $2,400 with the immediate reaction to reports of Israel striking Iran. Meanwhile, the pullback seen in the US Treasury bond yields helps XAU/USD hold its ground.

Gold News

Bitcoin Weekly Forecast: BTC post-halving rally could be partially priced in Premium

Bitcoin Weekly Forecast: BTC post-halving rally could be partially priced in

Bitcoin price shows no signs of directional bias while it holds above  $60,000. The fourth BTC halving is partially priced in, according to Deutsche Bank’s research. 

Read more

Week ahead – US GDP and BoJ decision on top of next week’s agenda

Week ahead – US GDP and BoJ decision on top of next week’s agenda

US GDP, core PCE and PMIs the next tests for the Dollar. Investors await BoJ for guidance about next rate hike. EU and UK PMIs, as well as Australian CPIs also on tap.

Read more

Forex MAJORS

Cryptocurrencies

Signatures