GameStop Stock Price and Forecast: Why is GME down again?
- GameStop shares continue to slide in market downswing.
- Meme stocks get hit hard as markets turn red.
- GME is down again in Monday's premarket.

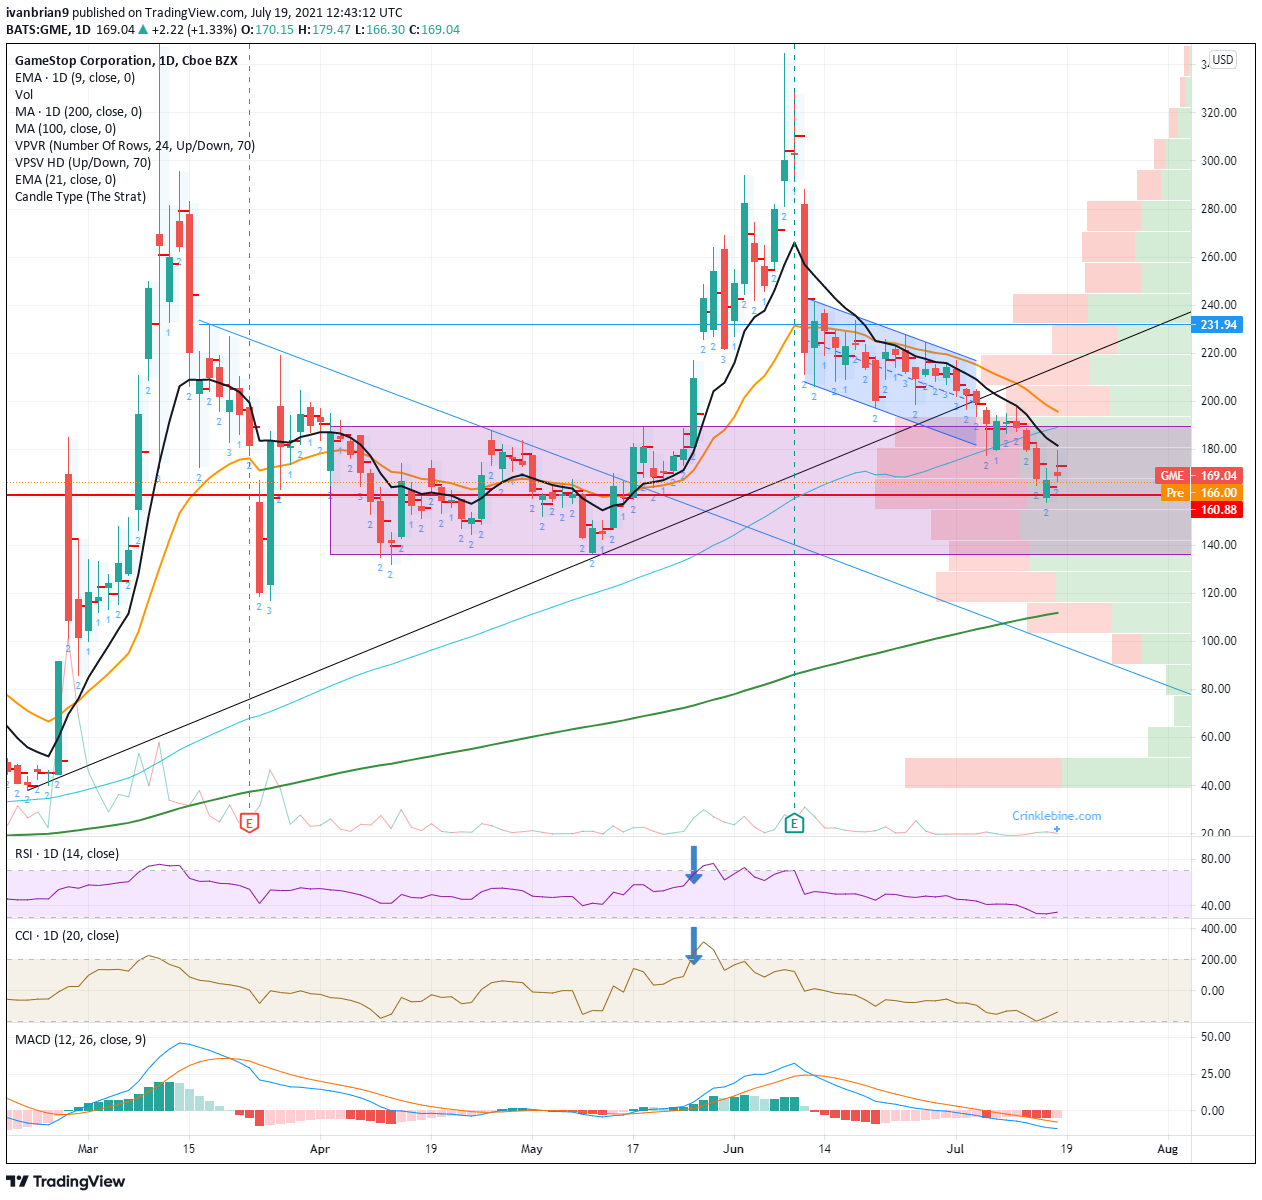
GameStop, the king meme name, has been suffering sharp falls of late as meme stocks start the week in negative territory. It probably has to happen eventually. Nothing can keep going up forever. GameStop filled the gap on the chart at $217 and just kept on going lower. Markets love to fill gaps, but the meme stock names all suffered. Once $200 broke, it was all hands on deck as the bears took over.
-637622944561173214.png)
Social media postings and Google search terms are a definite guide to this with WallStreetBets going mainstream. Apple and the S&P 500 ETF (SPY) have been trending highly on the site for the last number of weeks, while AMC and GME have fallen. A similar story emerges on Google search with search volumes for AMC and GME down over 65% from the 2021 peak.
GameStop key statistics
| Market Cap | $12.1 billion |
| Enterprise Value | $11.4 billion |
| Price/Earnings (P/E) | -123 |
|
Price/Book | 24 |
| Price/Sales | 2 |
| Gross Margin | 24% |
| Net Margin | -2% |
| EBITDA | -$112 billion |
| Average Wall Street rating and price target | Sell $88.33 |
GameStop (GME) stock forecast
GameStop has now entered the strong support zone or consolidation zone we identified back in April and May. This is where the last sharp fall stopped before a price consolidation occurred and GME stock spiked higher, so can the same thing happen?
The volume profile shows why this is a support zone. This is the area of price with the highest concentration of volume going back to March. We would expect the price to at least slow its fall if not stop falling. The point of control is at $160.88. This is the price with the highest amount of volume and so an equilibrium of sorts.
While the overall markets looks negative on Monday and the meme stock space unloved, it is time to consider a long entry position in my view. As ever, careful risk management is advised with a stop or else use a long option position to minimize risk. The strongest support is at $136.50, this is the low from May 11 that saw GME spike again to over $300. This is the preferred entry point. At present, the trend remains negative with the 9 and 21-day moving averages being broken and trending lower. The Relative Strength Index (RSI) and Moving Average Convergence Divergence (MACD) are also trending lower in line with the price. Traders prefer to be late into a trade to chase a breakout when indicators confirm a move, and at present this is not yet the case. If the RSI or MACD turn higher or the price breaks the 9-day moving average, it might be time to take a position before our preferred $136.50 support. For now, price action in the premarket looks negative, so sit tight. The best trades come from waiting for the right entry.
Like this article? Help us with some feedback by answering this survey:
Premium
You have reached your limit of 3 free articles for this month.
Start your subscription and get access to all our original articles.
Author

Ivan Brian
FXStreet
Ivan Brian started his career with AIB Bank in corporate finance and then worked for seven years at Baxter. He started as a macro analyst before becoming Head of Research and then CFO.


