GameStop (GME) Stock Price and Forecast: The game continues, but can results flag a breakout?
- GameStop shares fall slightly ahead of results out after market closes on Wednesday.
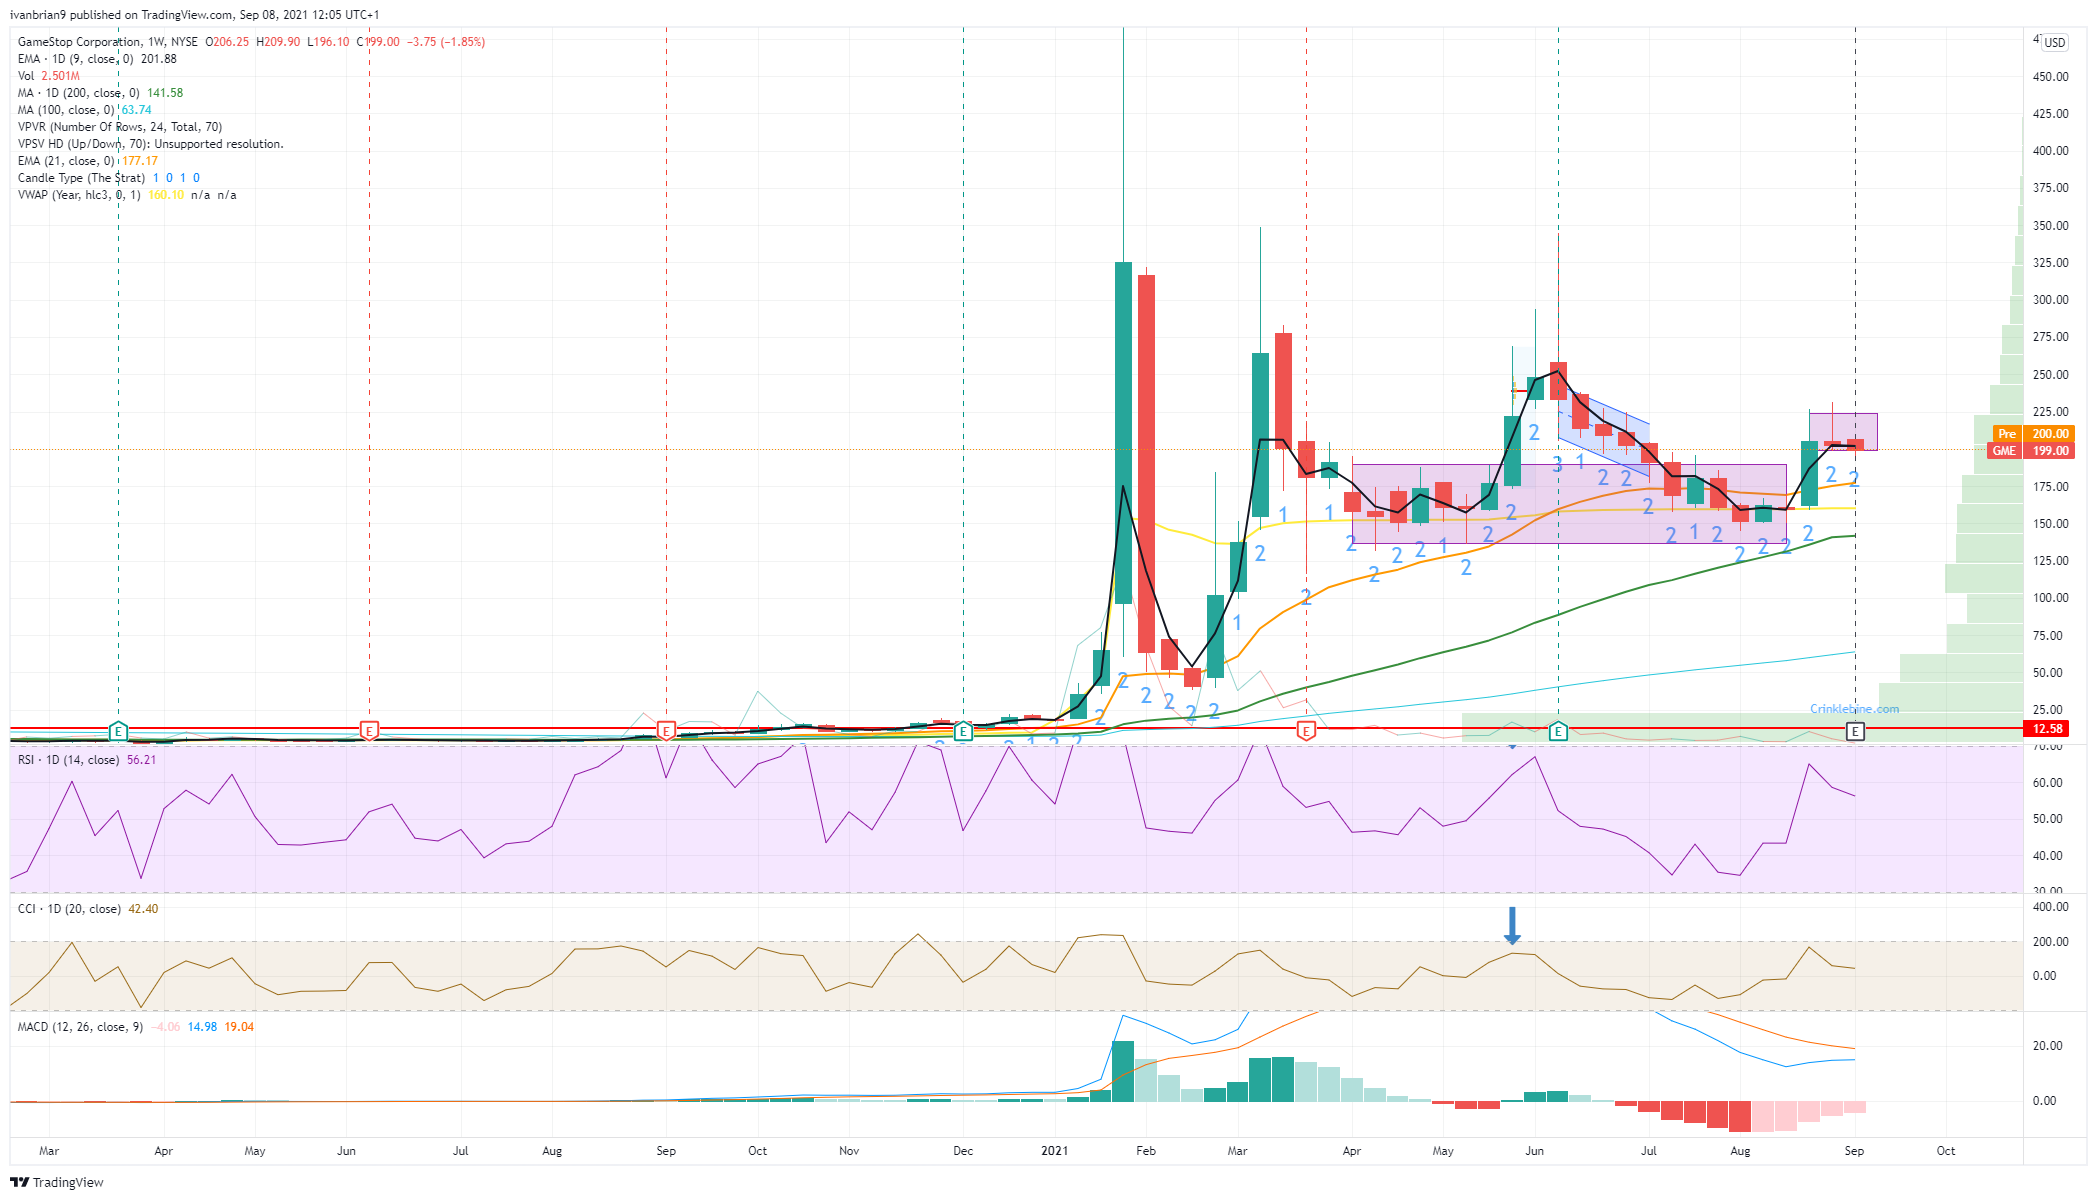
- GME forms a bullish continuation flag pattern.
- Talk ongoing about GME joining S&P 500.

GameStop (GME) shares took a breather on Tuesday as the stock fell nearly 2% to close at $199. The stock has been trading lightly as traders await the results due to be released after the close on Wednesday. There is a conference call after those results at 1700 EST/2200 BST. The earnings per share (EPS) number is expected to come in at -$0.66, while revenue is expected to come in at $1.12 billion. While the numbers themselves are important, the conference call will carry equal weight in the minds of traders as GameStop's transformation is what attracted them into the stock in the first place. They will want to hear how the transformation into an online presence is going under the guidance of Ryan Cohen and his new appointments.
The link to the conference call can be found here.
There has been some talk of GameStop being included in the S&P 500 Index going forward as it currently has a larger market cap than many S&P 500 constituents. One criteria will make this highly unlikely. In order to be eligible for inclusion in the S&P 500, a company must report positive earnings in the previous quarter and the sum of earnings from the previous four quarters combined must be positive. However, if Ryan Cohen and company manage to turn the business around and produce consistent profits, then it will have a chance if the market cap remains high enough. There are a lot of other criteria such as free float, market cap, liquidity, etc., but in terms of Gamestop, the profitability issue is likely the biggest hurdle. Four quarters though means a long time (actually that makes a year!), so this is not imminent in our opinion and who knows where the market cap will be in four quarters even if GME did manage the turnaround. It should be noted that GameStop was in the S&P 500 back in 2016.
GME key statistics
| Market Cap | $16.3 billion |
| Price/Earnings | |
| Price/Sales | 2.7 |
| Price/Book | 31.3 |
| Enterprise Value | $11 billion |
| Gross Margin | 0.24 |
| Net Margin |
-0.02 |
| 52 week high | $483 |
| 52 week low | $4.56 |
| Average Wall Street Rating and Price Target | Sell $88.33 |
GameStop (GME) stock forecast
The weekly chart does show one area of concern, each massive spike is getting progressively lower. However, the consolidation phase after each spike is now looking a bit more consistent around $150 than after the first spike back in January/February when GME dropped back to under $40.
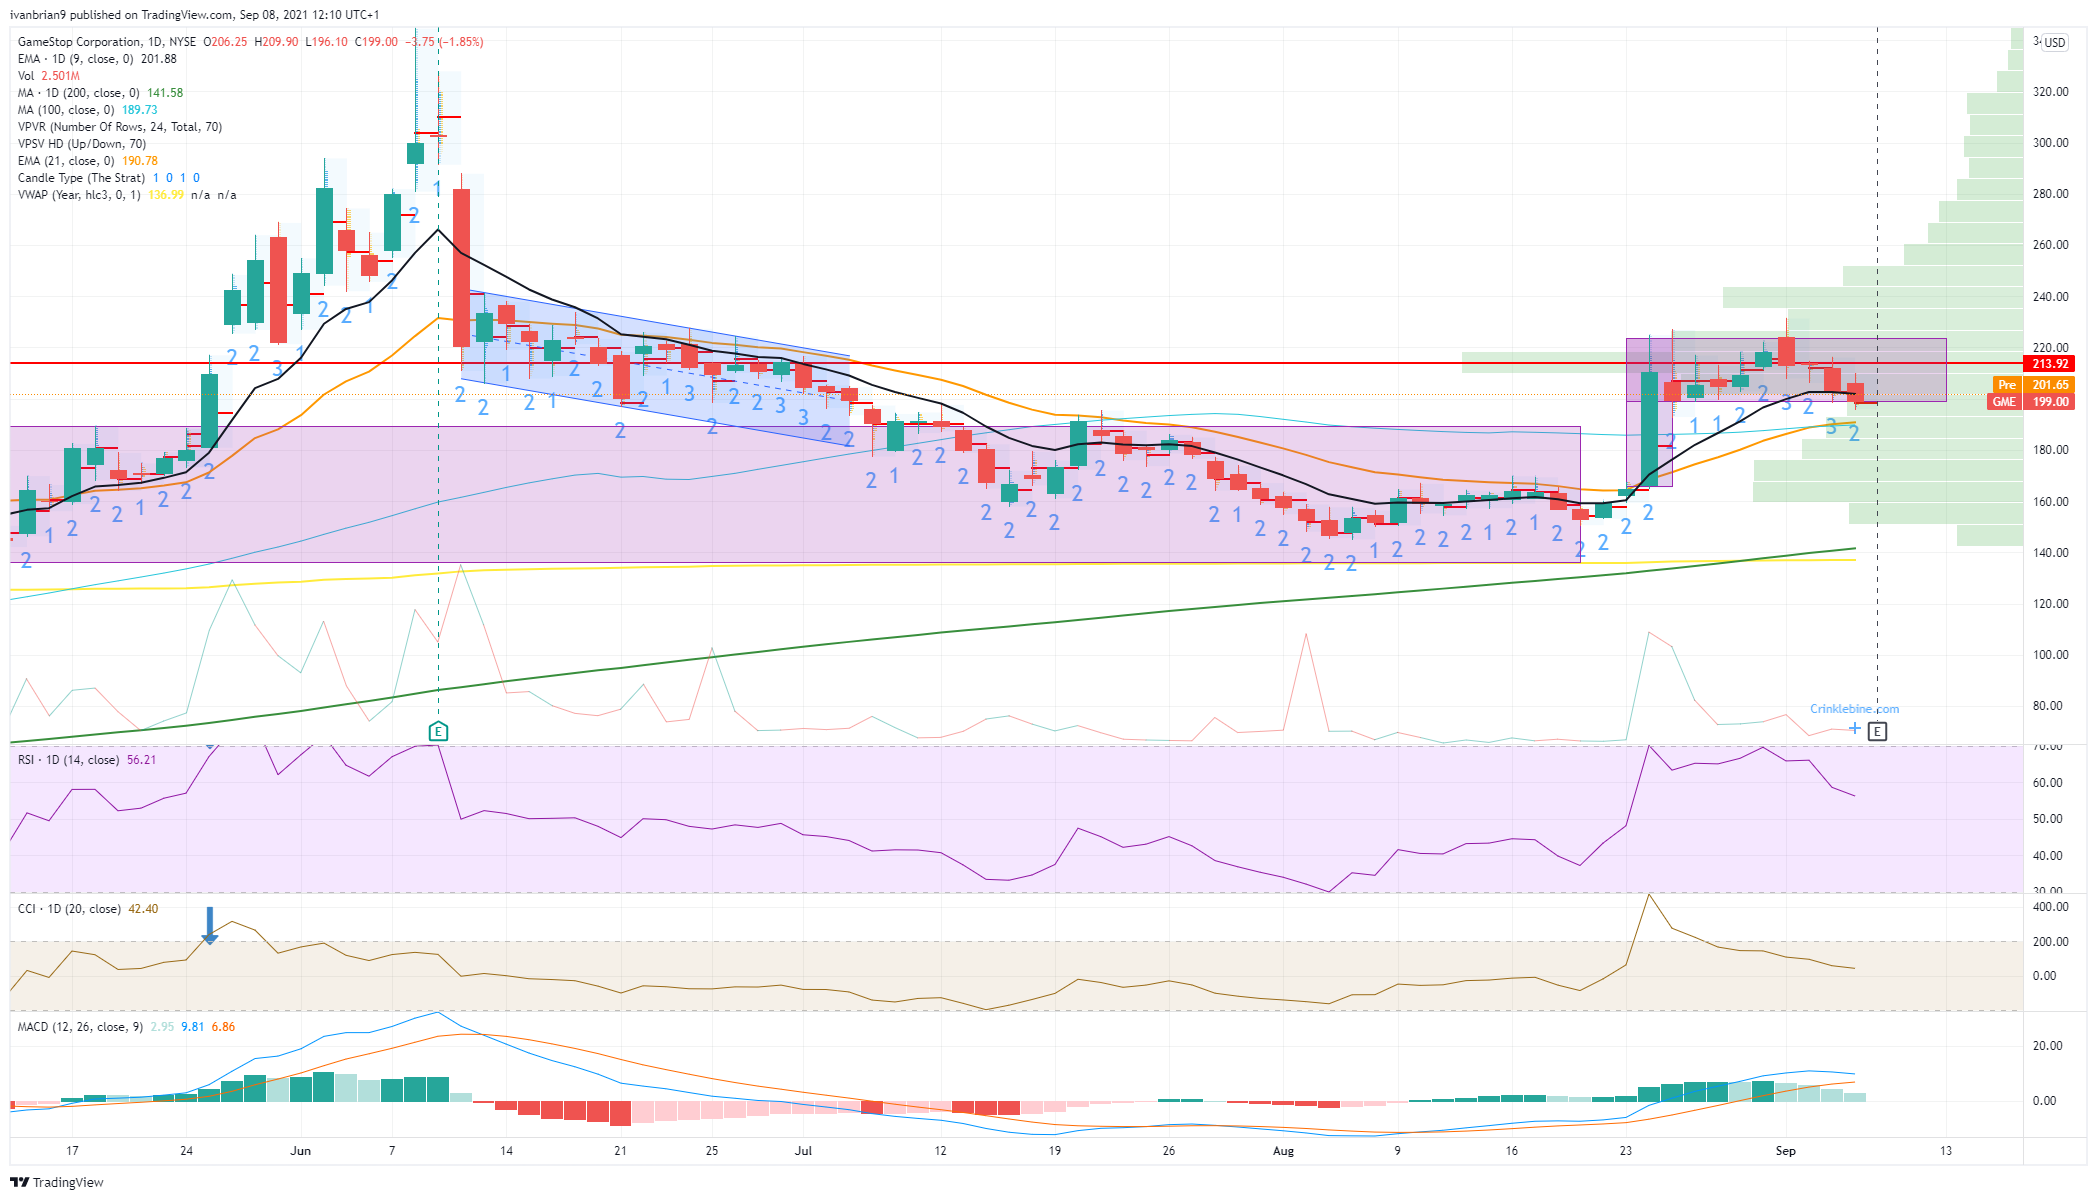
Taking a closer look at the daily chart, we can see the flag pattern that has formed after the breakout on August 24. Consolidations after a breakout are continuation patterns so long as they do not last too long. GameStop stock needs to break higher soon to keep the bullish trend going and earnings after the close could provide the catalyst. Once $250 is broken, volume thins out, meaning the price could accelerate. Holding $200 is key as this was the breakout back on August 24.
Bullish above $200, neutral $190-200, bearish under $190 as that is the 21 and 100-day Simple Moving Average (SMA) with next support at $140-150 from the 200-day SMA.
Author

Ivan Brian
FXStreet
Ivan Brian started his career with AIB Bank in corporate finance and then worked for seven years at Baxter. He started as a macro analyst before becoming Head of Research and then CFO.


