GameStop (GME) Stock Price and Forecast: Is the game over for now?
- GameStop releases results after the close on Wednesday.
- GME results were mixed.
- GME stock dropped after hours when the results came out.

GameStop (NYSE: GME) stock dropped after the release of Q2 results after the bell on Wednesday. The results were mixed with revenue coming in ahead of forecasts, but earnings per share (EPS) missing the target. Revenue was $1.18 billion just ahead of the $1.12 estimate from Wall Street, but EPS came in at $-0.76 behind the $-0.66 estimate. Those analysts total only four, an unusual occurrence for a stock with a market cap that would make it eligible for S&P 500 inclusion if it were not for other criteria such as its loss-making.
Shares in GameStop (GME) pretty much tanked straight away following the release of earnings despite the revenue figure increasing. This is the second quarter of revenue growth, but as usual the headline EPS took the shine off things. The shares did briefly recover before the conference call, but this is where investors appeared most disappointed. GME gave few details on the conference call about its strategy to turn things around and it did not give forecasts for future earnings, something quite common. This had been telegraphed by Ryan Cohen earlier in the summer, so it should not have come as much of a surprise. He said in June not to expect too much detail or plans as we will not be telegraphing ideas to competitors. Investors and traders on social media vented their frustrations though after the conference call, and this is when volume spiked in the afterhours session and when most of the selling pressure was felt. GameStop (GME) stock is currently trading at $184.50 in Thursday's premarket, a loss of over 7% from Wednesday's regular session close.
An interesting side note is that AMC CEO Adam Aron said in an interview with Liz Clayman of Fox Business on Wednesday that, "We've made contact with GameStop on a partnership. We're not ready to say what it is though."
GME key statistics
| Market Cap | $14.3 billion |
| Price/Earnings | -181 |
| Price/Sales | 2.7 |
| Price/Book | 31.3 |
| Enterprise Value | $11 billion |
| Gross Margin | 0.24 |
| Net Margin |
-0.02 |
| 52 week high | $483 |
| 52 week low | $4.56 |
| Average Wall Street Rating and Price Target | Sell $88.33 |
GME stock forecast
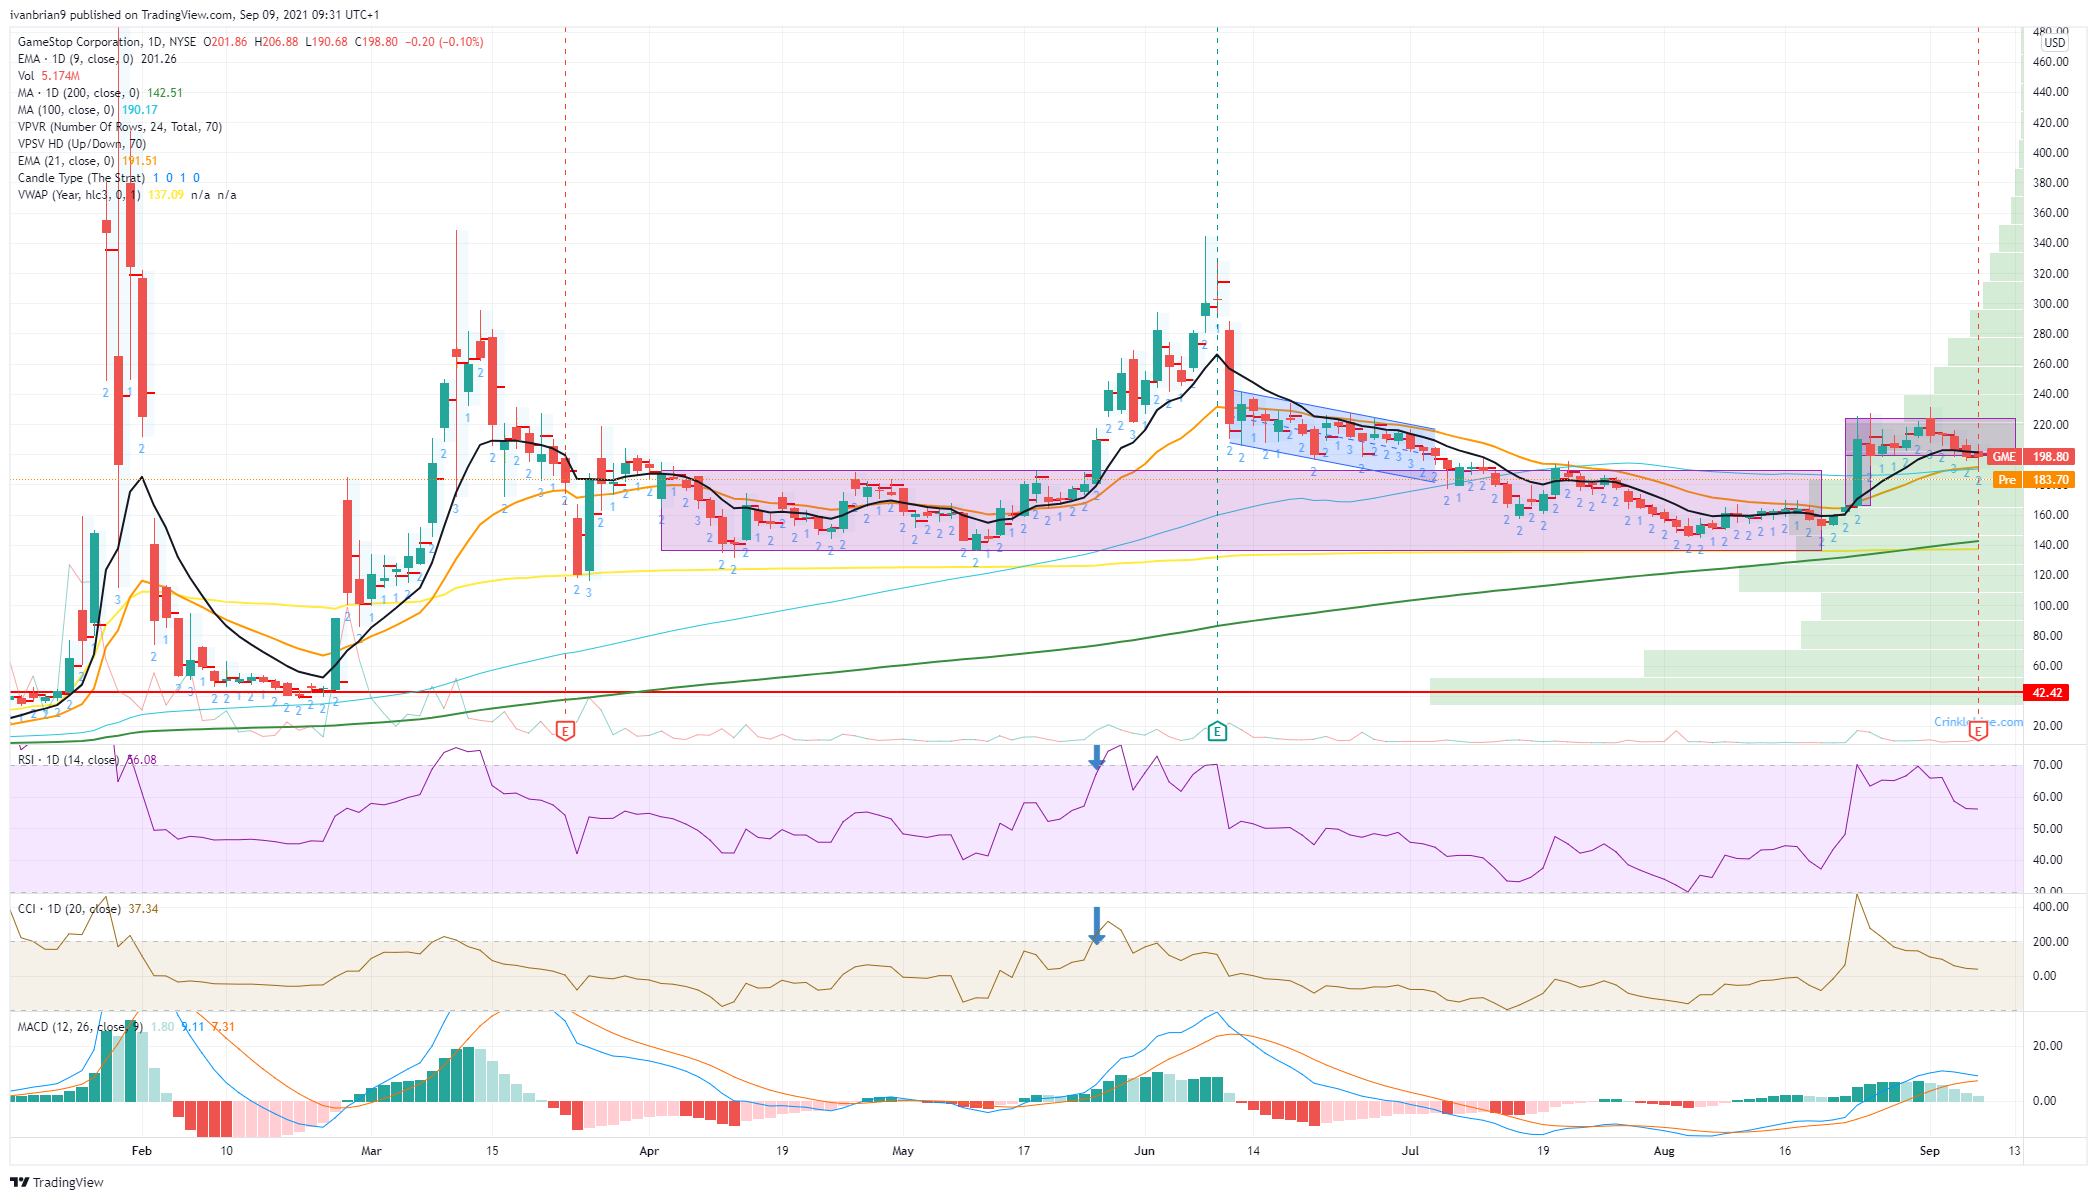
In our analysis this week we have been focusing on the bullish continuation flag that GME stock formed after the breakout on August 24. It now appears that this is over alongside the bullish tone. Unless something dramatic happens between now and the open of the regular session we are going to get an ugly red candle taking us back into the large consolidation area highlighted. This would also result in another lower price spike, which we had issued concern over yesterday. The weekly chart below shows that each price spike is getting lower and lower and less and less powerful. The only slight positive is that the consolidation area around $150 remains the same after each spike.
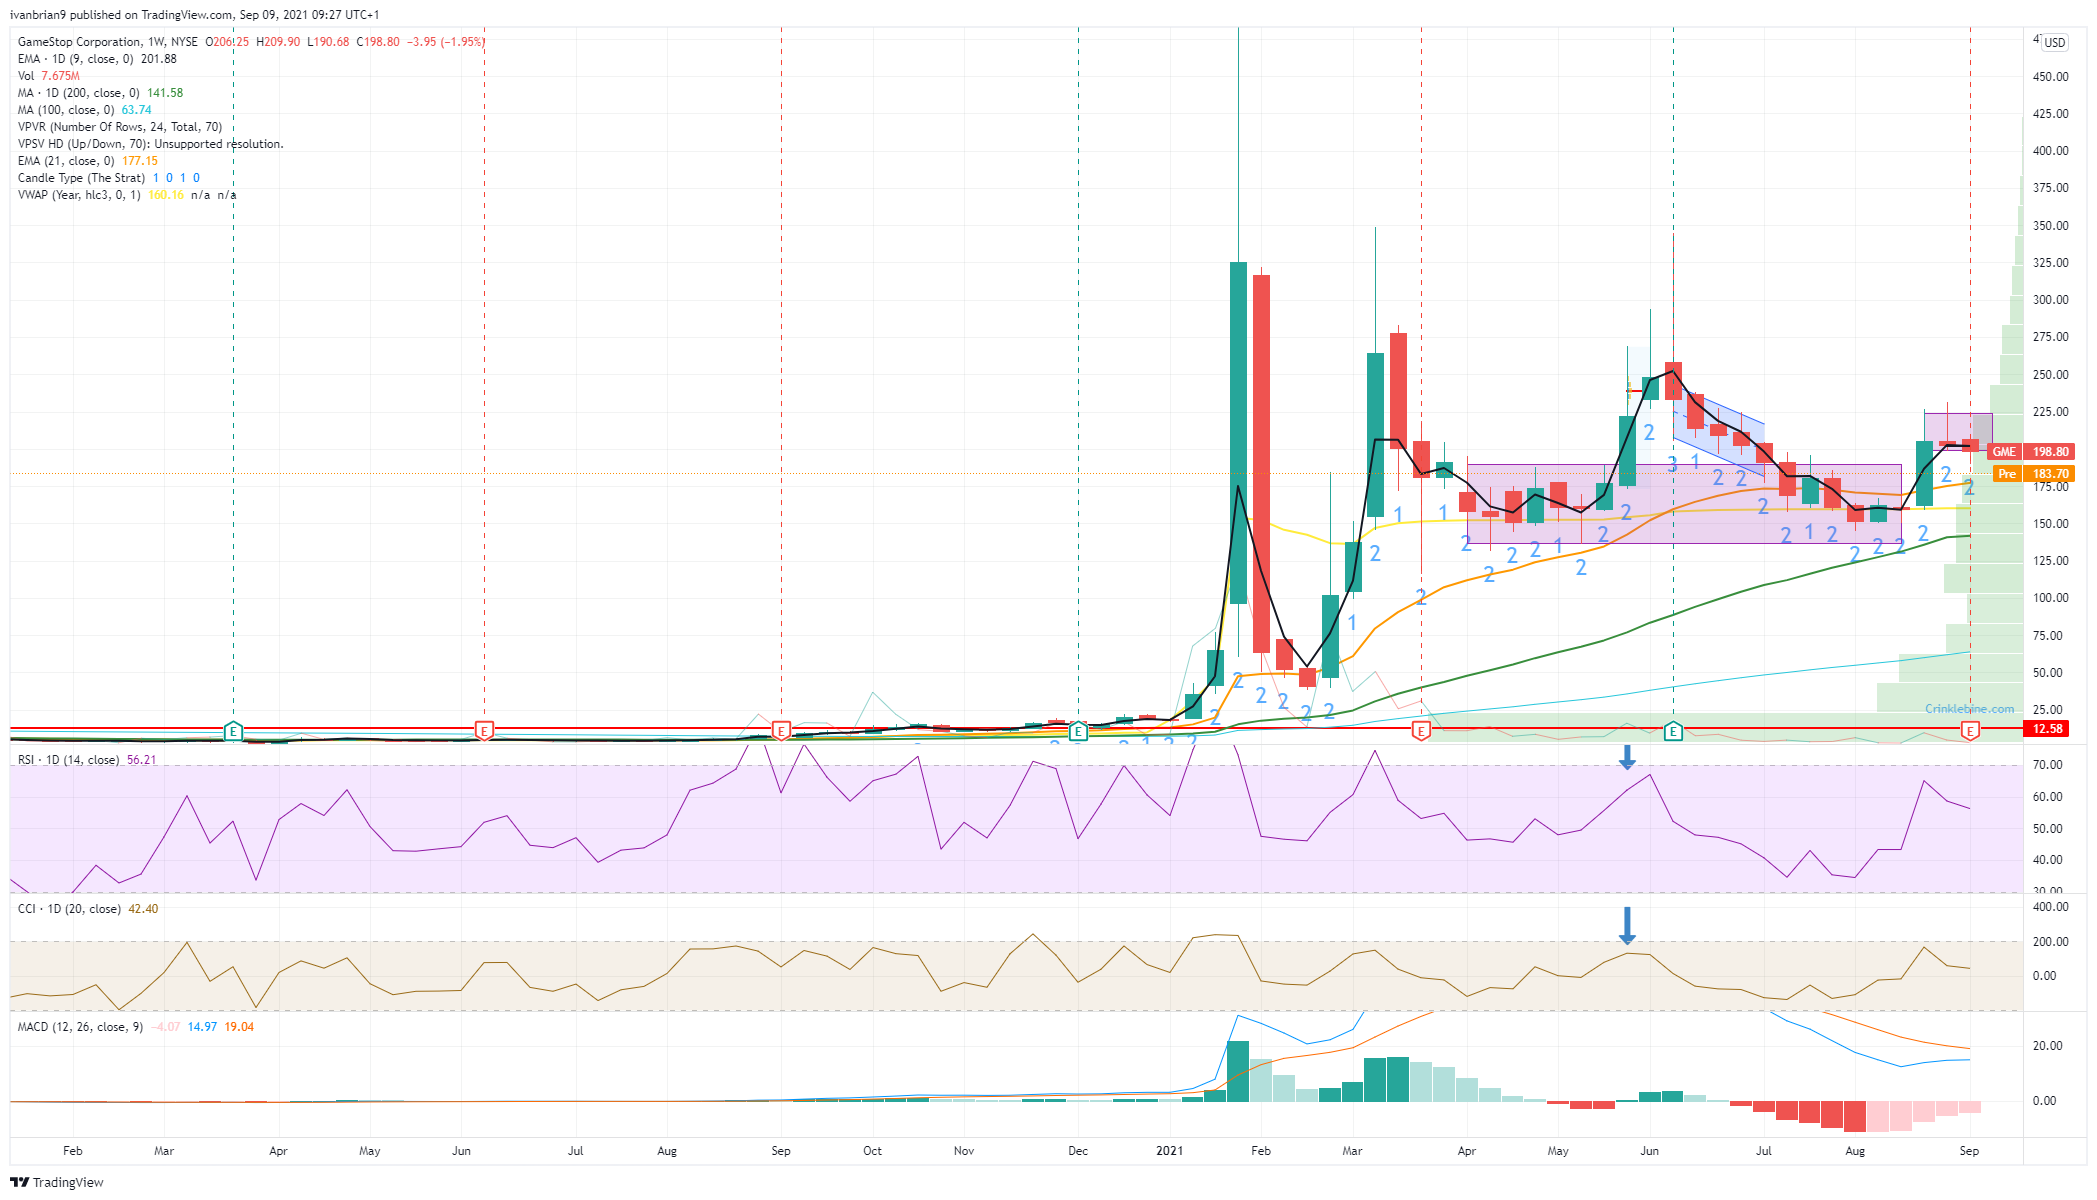
Now that GME has broken back below the flag, the bullish move is certainly over. From a technical view, we are now bearish despite entering the consolidation zone. The stock is trading below the short-term moving averages, and the Relative Strength Index (RSI) is trending lower and is about to go below 50. The next support zone we see is at $140 from the 200-day moving average and the yearly Volume Weighted Average Price (VWAP).
Author

Ivan Brian
FXStreet
Ivan Brian started his career with AIB Bank in corporate finance and then worked for seven years at Baxter. He started as a macro analyst before becoming Head of Research and then CFO.


