GameStop Stock Price and Forecast: Is GME flagging a bullish breakout?
- Gamestop moved 27% higher last week but has stalled since.
- The meme stock forms a bullish flag pattern, hinting a continuation trend.
- GME now lagging other meme stocks such as AMC and SKLZ.

Is GameStop ready to break out again? Last week the stock surged over 27% as meme stocks returned to the forefront of trader's minds. Since then, though, the meme traders appear to have forgotten about the former king and focused on the shiny new toy of AMC.
On Tuesday, further insult was added to the Gamestop throne with a new kid on the block, SKLZ, showing how it is done with an 11% breakout move. GME stock by comparison had a modest 4% gain, while AMC registered nearly 9% up on the day. Is GME now ready to recapture its meme-stock throne?
GME key statistics
| Market Cap | $16.1 billion |
| Price/Earnings | |
| Price/Sales | 2.7 |
| Price/Book | 31.3 |
| Enterprise Value | $11 billion |
| Gross Margin | 0.24 |
| Net Margin |
-0.02 |
| 52 week high | $483 |
| 52 week low | $4.56 |
| Average Wall Street Rating and Price Target | Sell $88.33 |
GME stock forecast
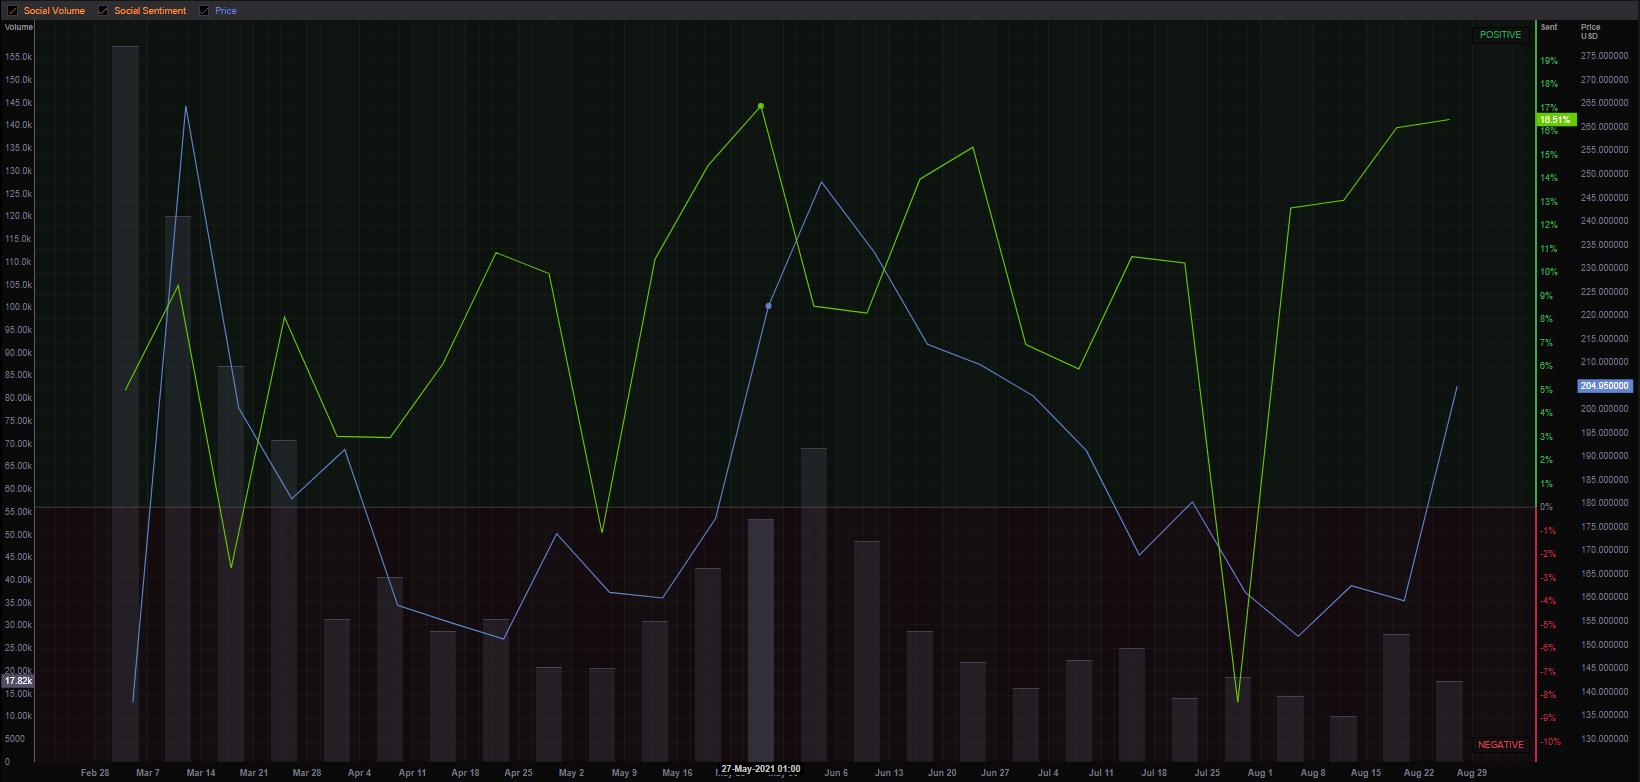
There is a reasonable level of correlation between social media sentiment and the underlying GME share price. You may think it is higher given that GME was the original poster stock for meme stock madness, but there is so much data to filter it can be difficult to get an accurate picture. The Refinitiv social media chart below shows the volume of mentions on social media to possibly be a more accurate tool, and these are still well down from levels seen back in February. Sentiment, though, has clearly increased lately.
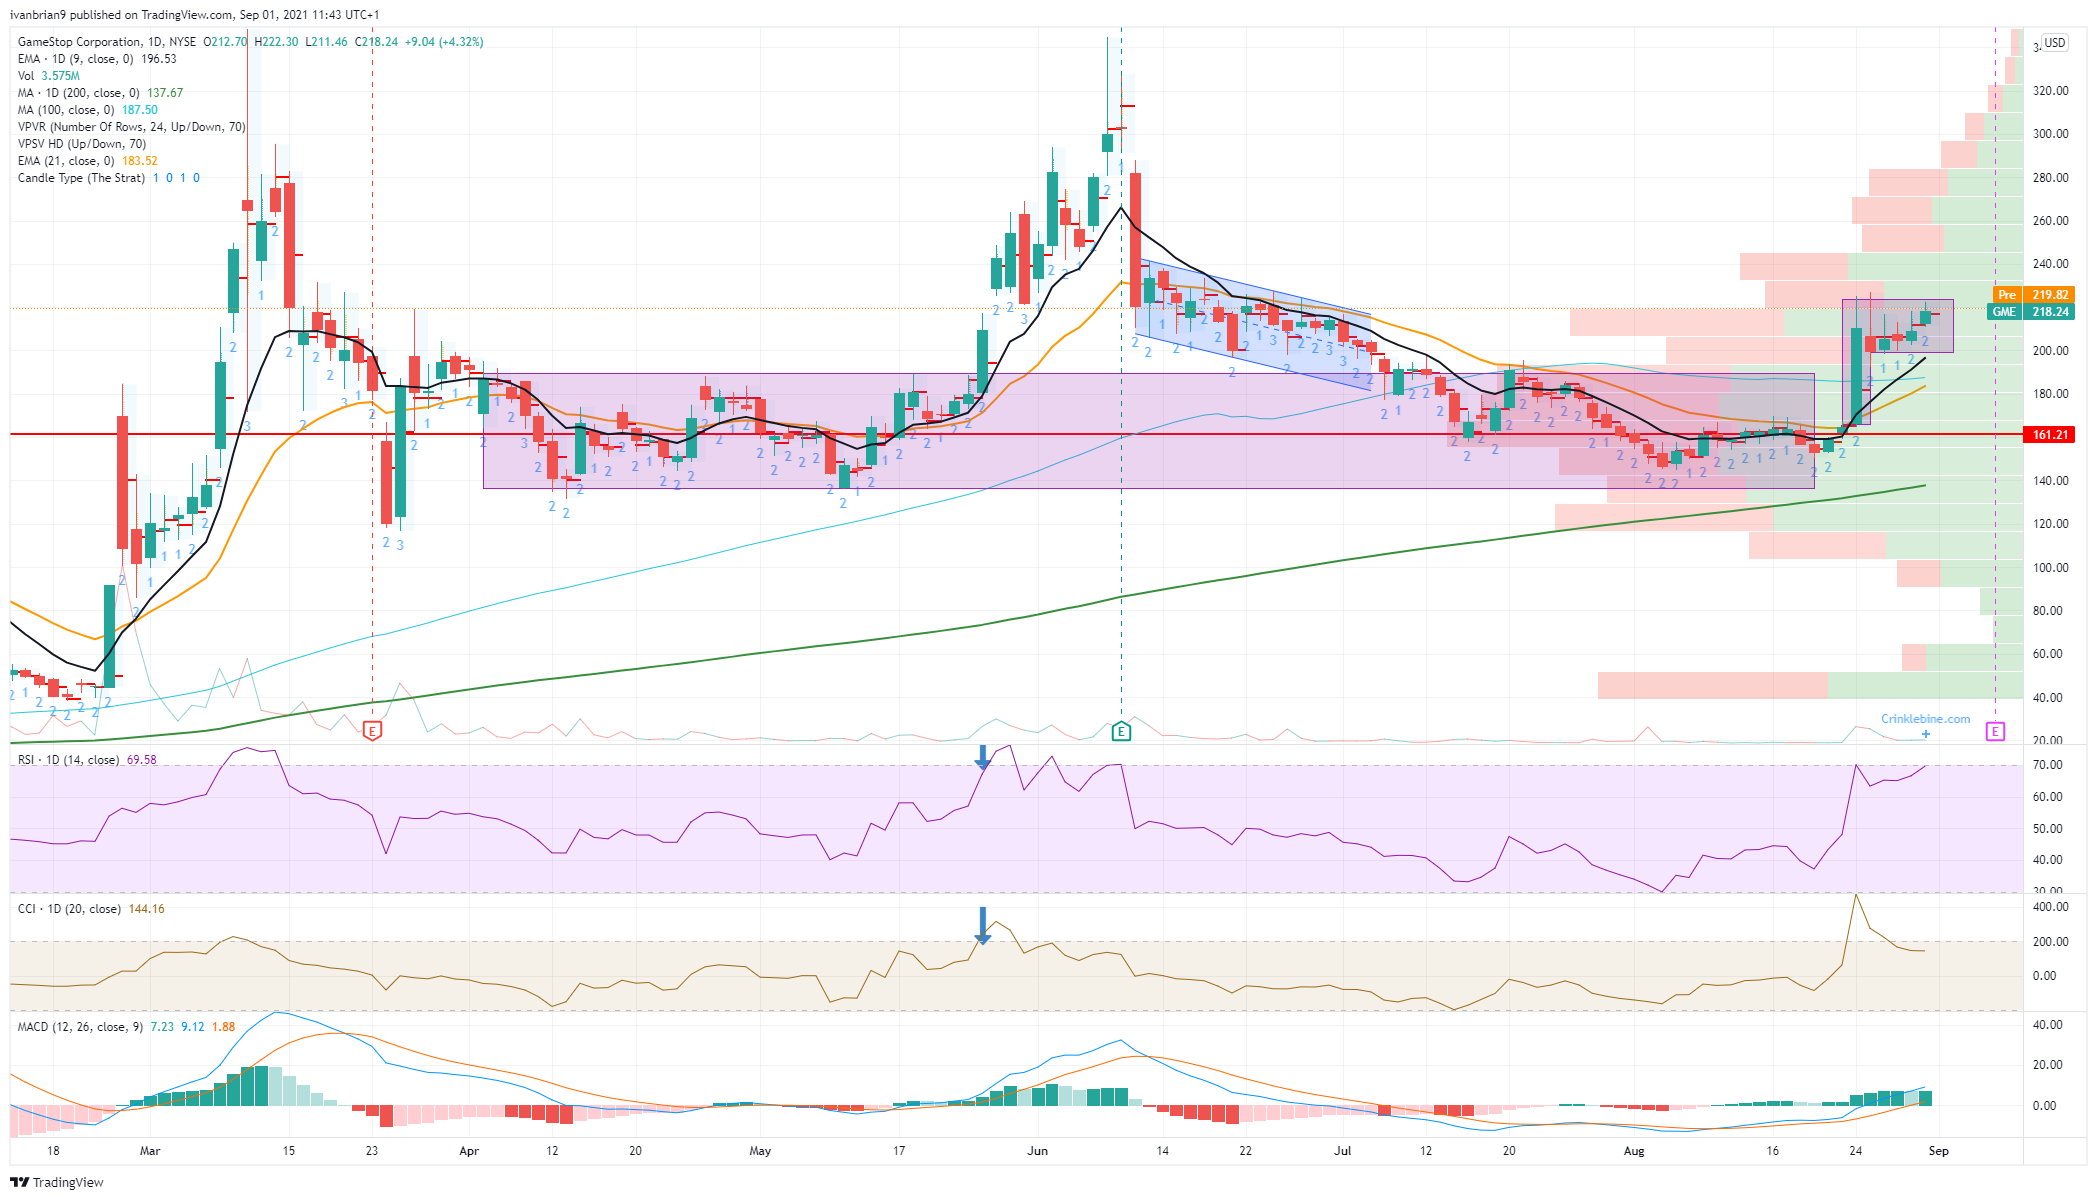
The chart below does show some nice potential with the formation of a bullish continuation flag. Regular readers will note my drawing skills have improved remarkably from the earlier flag drawing on the Palantir chart, see here. A perfect breakout occurred with the 27% surge on August 24. This was a meme stock day with AMC also popping over 20% that day before stocks settled down ahead of the Jackson Hole speech. Now that risk is back on and rates are not rising anytime soon, stock rallies are back on and nothing rallies better than a meme stock.
GME has then formed a consolidation phase after the breakout and this is usually a continuation trend, as the stock pauses to attract more buyers and interest. The volume profile bars show that GME really wants to get above $250 to enter an area of low volume and low resistance. The key support to hold is a neat $200 round number psychological level, but this is importantly the low of the flag formation.
Like this article? Help us with some feedback by answering this survey:
Premium
You have reached your limit of 3 free articles for this month.
Start your subscription and get access to all our original articles.
Author

Ivan Brian
FXStreet
Ivan Brian started his career with AIB Bank in corporate finance and then worked for seven years at Baxter. He started as a macro analyst before becoming Head of Research and then CFO.


