Game Stop (GME Stock): A wave (V) might happen with minimum target $182.00

$GME (Game Stop) has been in a tremendous rally since it reached the blue box buying around the $8.20 area. The market has changed, and there is no question computers have taken over the market. We have done a series of articles explaining this idea. The market is always a fight between buyers and sellers. Knowing the areas where to enter is key. We are trading in 2021, which means computers play a role. Consequently, we present the blue boxes to members in each time frame.
It is impossible to trade within the fighting area between buyers and sellers. It's much better to trade the blue boxes. Game Stop is a clear example of a Blue Box working and how the moment the Box has been reached a reaction higher started. Please read the following article to understand how we look at the Market. We mention the blue box and Game Stop because many people are looking at fundametal reasons to explain this tremendous rally. However, what's interesting is the move happens from the blue box. The Rally is clear in Three waves, which we label in Blue, but another low was made around $60.00, which we label as a wave (IV). Wave (V) minimum target is the 123.6 – 161.8% external Fibonacci retracement of wave (IV), which comes at $182.68-$220.30. The Following chart illustrates the move.
GME Monthly Elliott Wave Chart
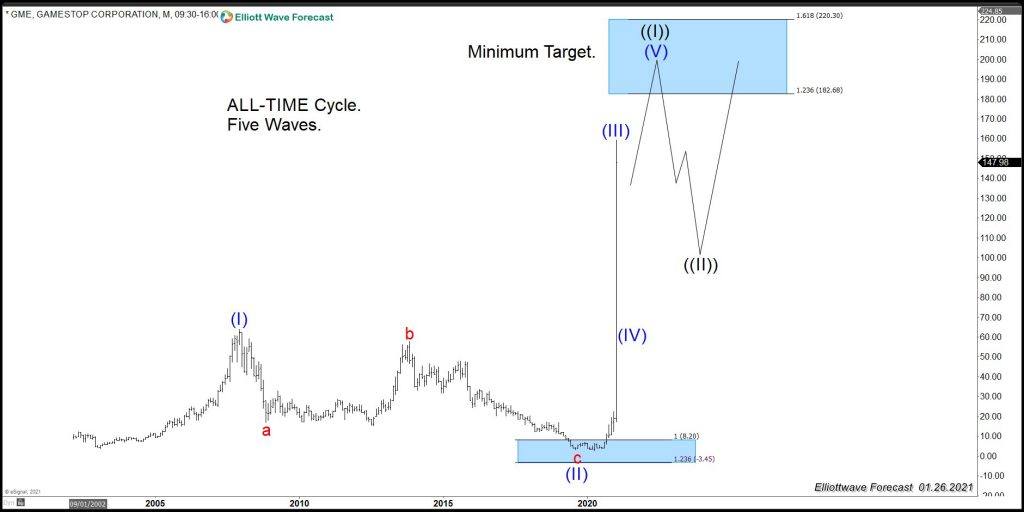
The chart above reflect the idea explained earlier of the five waves advance since the all-time lows. The chart also shows the blue box area and the reaction from the blue box, which proves the reaction's technical aspect.
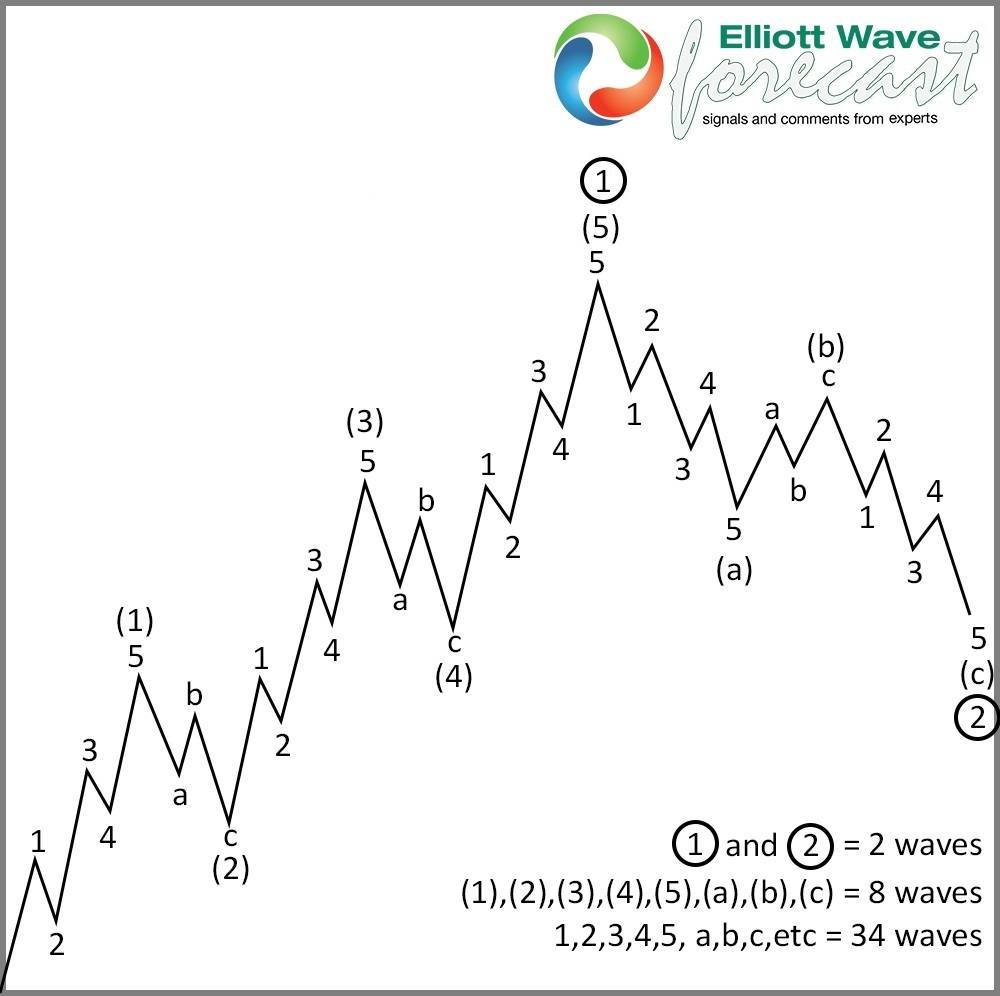
The Elliott Wave Theory is clear in what a number five means overall. A break in GME above 159.18 will mean fives or swings, and buyers are in full control. The Five waves look like the following chart:
After Gamestop reaches $182.62 – $220.30 target, it should do a big three waves pullback which will provide another great opportunity to buy. The Five waves is the more conservative view and the classic pattern in the Theory.
Another meaning of the five swing is a nest's possibility, a series of five waves into a huge acceleration. A nest in the Elliott Wave Theory is reflected in the following chart:
As we can see, a series of five waves happened, and then the extension and separation into the five waves' direction.
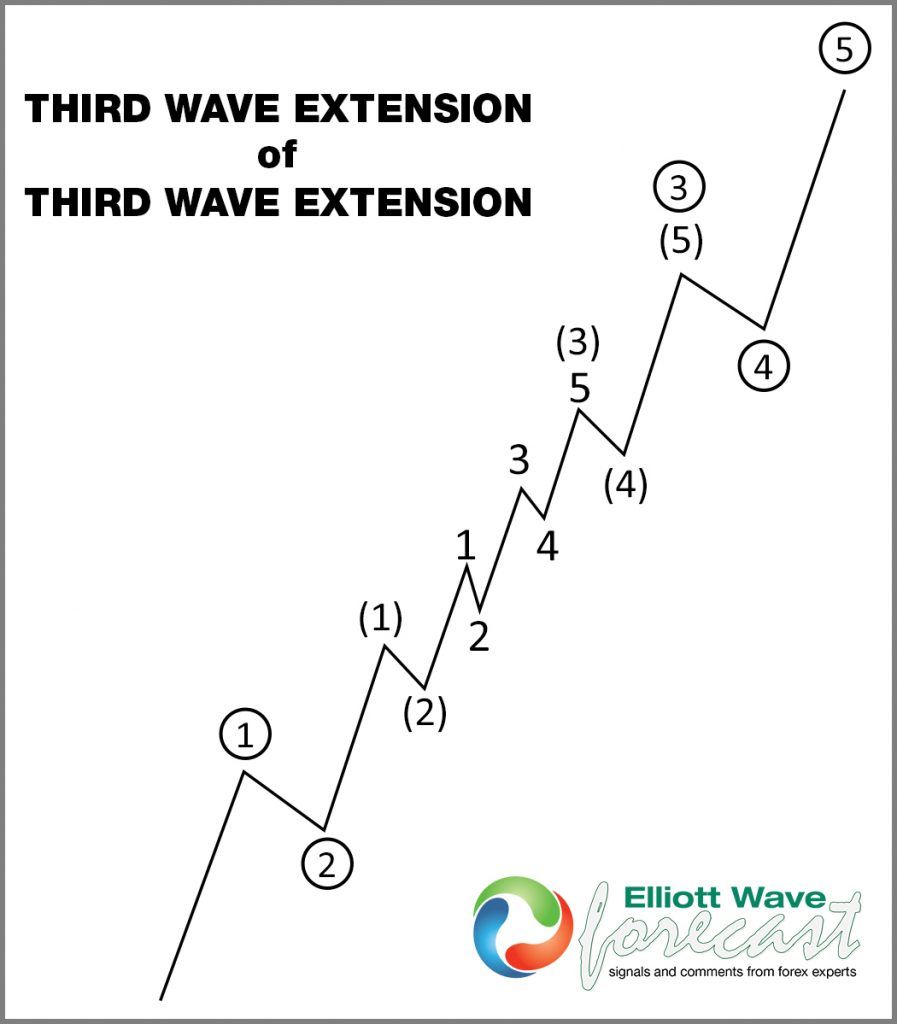
In a nesting scenario, GME Elliott Wave count will be different than the one presented earlier, which is ending all-time cycle and doing the biggest 3 waves pullback. The nest makes the previous wave (IV) to be a wave II and now begins wave III into a higher level and huge acceleration. The following chart shows the nesting count:
GME Monthly Elliott Wave Chart – A Nesting Scenario
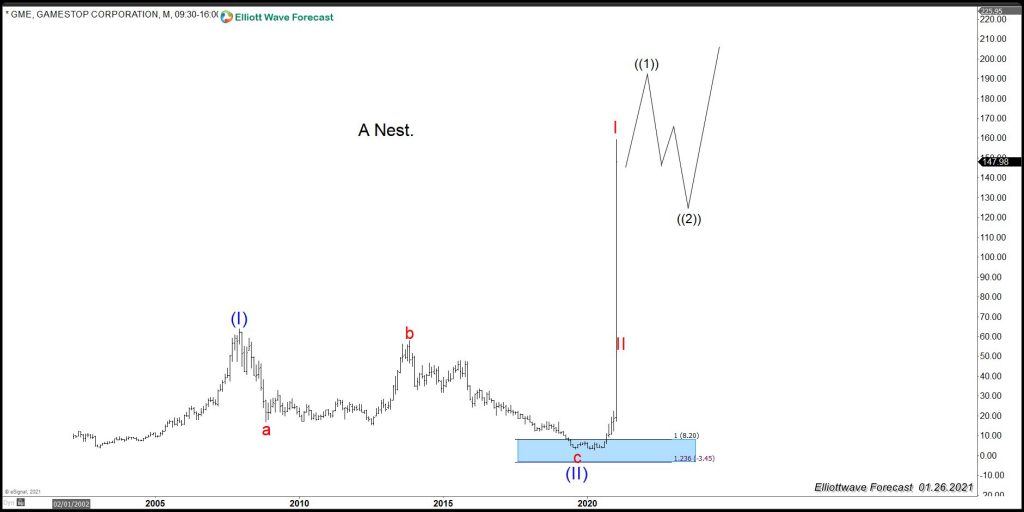
The nest is the most aggressive view. One of the two scenarios above is likely to play out, but a break above 159.18 will place the buy the dips trade in control.
Premium
You have reached your limit of 3 free articles for this month.
Start your subscription and get access to all our original articles.
Author

Elliott Wave Forecast Team
ElliottWave-Forecast.com


