FTSE 100 (UK) Elliott Wave technical analysis [Video]
![FTSE 100 (UK) Elliott Wave technical analysis [Video]](https://editorial.fxsstatic.com/images/i/Equity-Index_FTSE-2_XtraLarge.jpg)
FTSE 100 (UK) Elliott Wave Analysis - Trading Lounge Day Chart
FTSE 100 (UK) Elliott Wave technical analysis
Analysis overview
-
Function: Bullish Trend.
-
Mode: Impulsive.
-
Structure: Orange Wave 5.
-
Position: Navy Blue Wave 3.
-
Direction (next lower degree): Navy Blue Wave 4.
-
Invalidation level: 7,997.82.
The analysis focuses on the FTSE 100 index, applying Elliott Wave Theory on the daily chart to identify a bullish trend with an impulsive mode. The primary wave under observation is orange wave 5, which has started following the completion of orange wave 4, signaling the continuation of the upward trend.
Currently, the index is positioned within navy blue wave 3, part of the broader orange wave 5 structure. This development underscores strong bullish momentum and suggests further upward movement. Upon the completion of navy blue wave 3, the emergence of navy blue wave 4 is expected as the next lower-degree corrective phase before the trend resumes higher.
The invalidation level for the current wave count is established at 7,997.82, acting as a crucial threshold. A decline below this level would invalidate the current bullish outlook, necessitating a reassessment of the market structure and future expectations.
Summary
The daily FTSE 100 chart analysis presents a strong bullish trend, reinforced by the advancement of orange wave 5 and the completion of orange wave 4. The ongoing development of navy blue wave 3 suggests further upside potential within the Elliott Wave framework. The anticipated formation of navy blue wave 4 is likely to provide a corrective phase before the continuation of the bullish trend.
The invalidation level serves as a key reference point for risk management and ensures alignment with the projected wave count. This analysis offers traders structured insights into the ongoing bullish trend, enabling them to align their strategies and track key levels for potential market adjustments.
.png.c636773e644b15fb42b12733f589c8af.png)
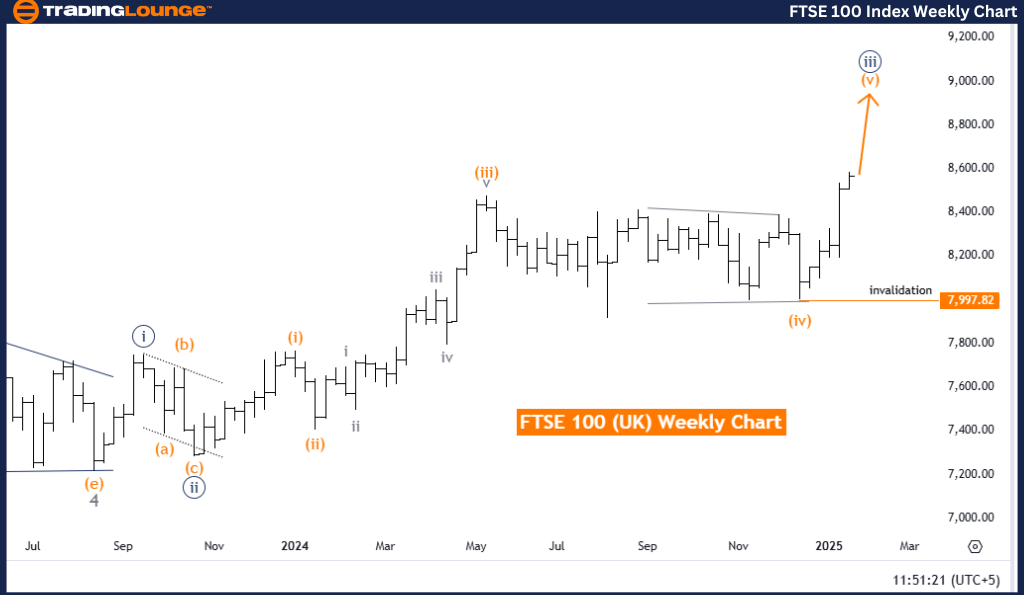
FTSE 100 (UK) Elliott Wave technical analysis
Analysis overview
-
Function: Bullish Trend.
-
Mode: Impulsive.
-
Structure: Orange Wave 5.
-
Position: Navy Blue Wave 3.
-
Direction (next lower degree): Navy Blue Wave 4.
-
Invalidation level: 7,997.82.
The analysis examines the FTSE 100 index using Elliott Wave Theory on a weekly chart, identifying a bullish trend with an impulsive mode. The primary focus is on orange wave 5, which has commenced following the completion of orange wave 4, signaling a continued upward trajectory in the market.
Currently, the index is within navy blue wave 3, which is part of the broader orange wave 5 structure. This wave reflects ongoing bullish momentum and suggests potential further price gains. Once navy blue wave 3 concludes, the emergence of navy blue wave 4 is expected as a corrective phase before the bullish trend resumes within orange wave 5.
The invalidation level for this wave count is set at 7,997.82, serving as a critical threshold. A decline below this point would invalidate the current wave structure and require a reassessment of the market outlook.
Summary
The weekly FTSE 100 chart analysis highlights a robust bullish trend, supported by the ongoing progression of orange wave 5. The completion of orange wave 4 and the development of navy blue wave 3 emphasize the current upward momentum. The expected formation of navy blue wave 4 presents a potential corrective phase before further bullish continuation.
The invalidation level serves as an essential risk management tool and confirms the validity of the Elliott Wave structure. This analysis provides traders with structured insights into the market's bullish trajectory, helping them align their trading strategies with the ongoing trend while staying aware of critical levels for necessary adjustments.
FTSE 100 (UK) Elliott Wave technical analysis [Video]
Author

Peter Mathers
TradingLounge
Peter Mathers started actively trading in 1982. He began his career at Hoei and Shoin, a Japanese futures trading company.


