FTSE 100 in favour of a possible consolidation in the 7.250 - 7.300 area
FTSE 100 (UKX)
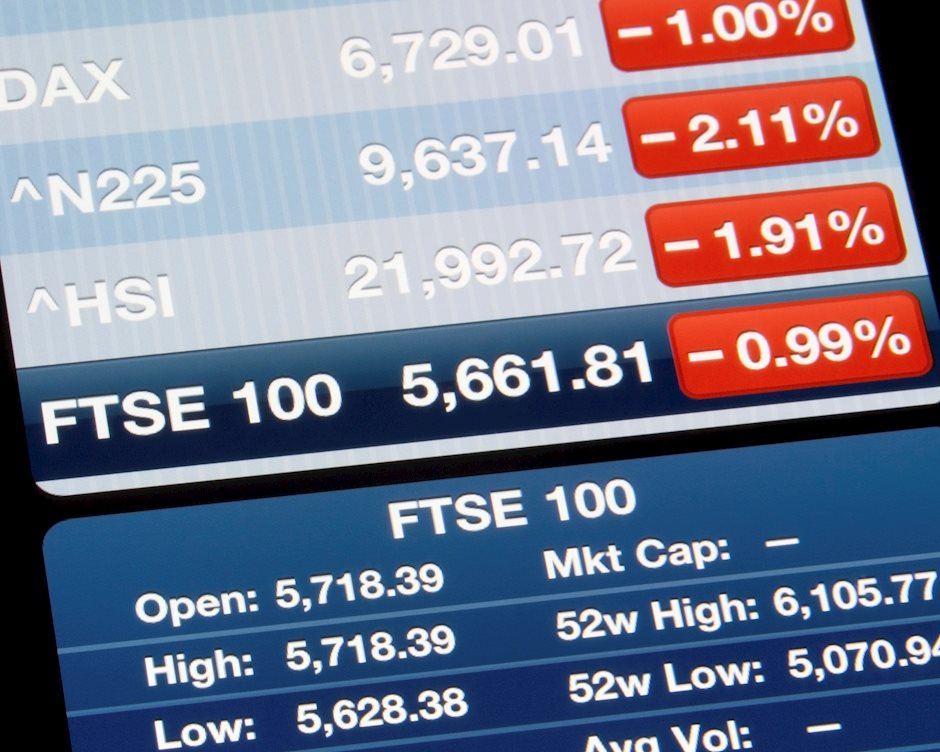
The FTSE100 index had a week down by -1.69% For the week ahead we are in favour of a possible consolidation in the 7.250 - 7.300 area.
| Current price | Forecast | S1 | R1 | S2 | R2 |
| 7,333 | Bearish/ Cons. | 7,200 | 7,600 | 7,100 | 7,670 |
Indicators
Negative week for the British index, as it almost seems to want to repeat the August 2022 setup's.
As highlighted last week, the break of the 9-day average (red line) paved the way for even more substantial declines.
The MACD and RSI have reversed significantly, with the latter already in bearish territory.
The area between 7.250 - 7.300 could represent a possible break from the bearish pressure which we think is only just beginning. In the short to medium term, we believe a plausible target could be 7,100.
We remain bearish on the FTSE 100 as we believe that risk/reward is still in favor of further downsides: the short-term target remains the 50-day average (yellow line), today at 7,250, we look at 7,100 as a possible reversal area.
Support at 7,150.
Resistance at 7,600.

FTSEMIB (FTSEMIB)
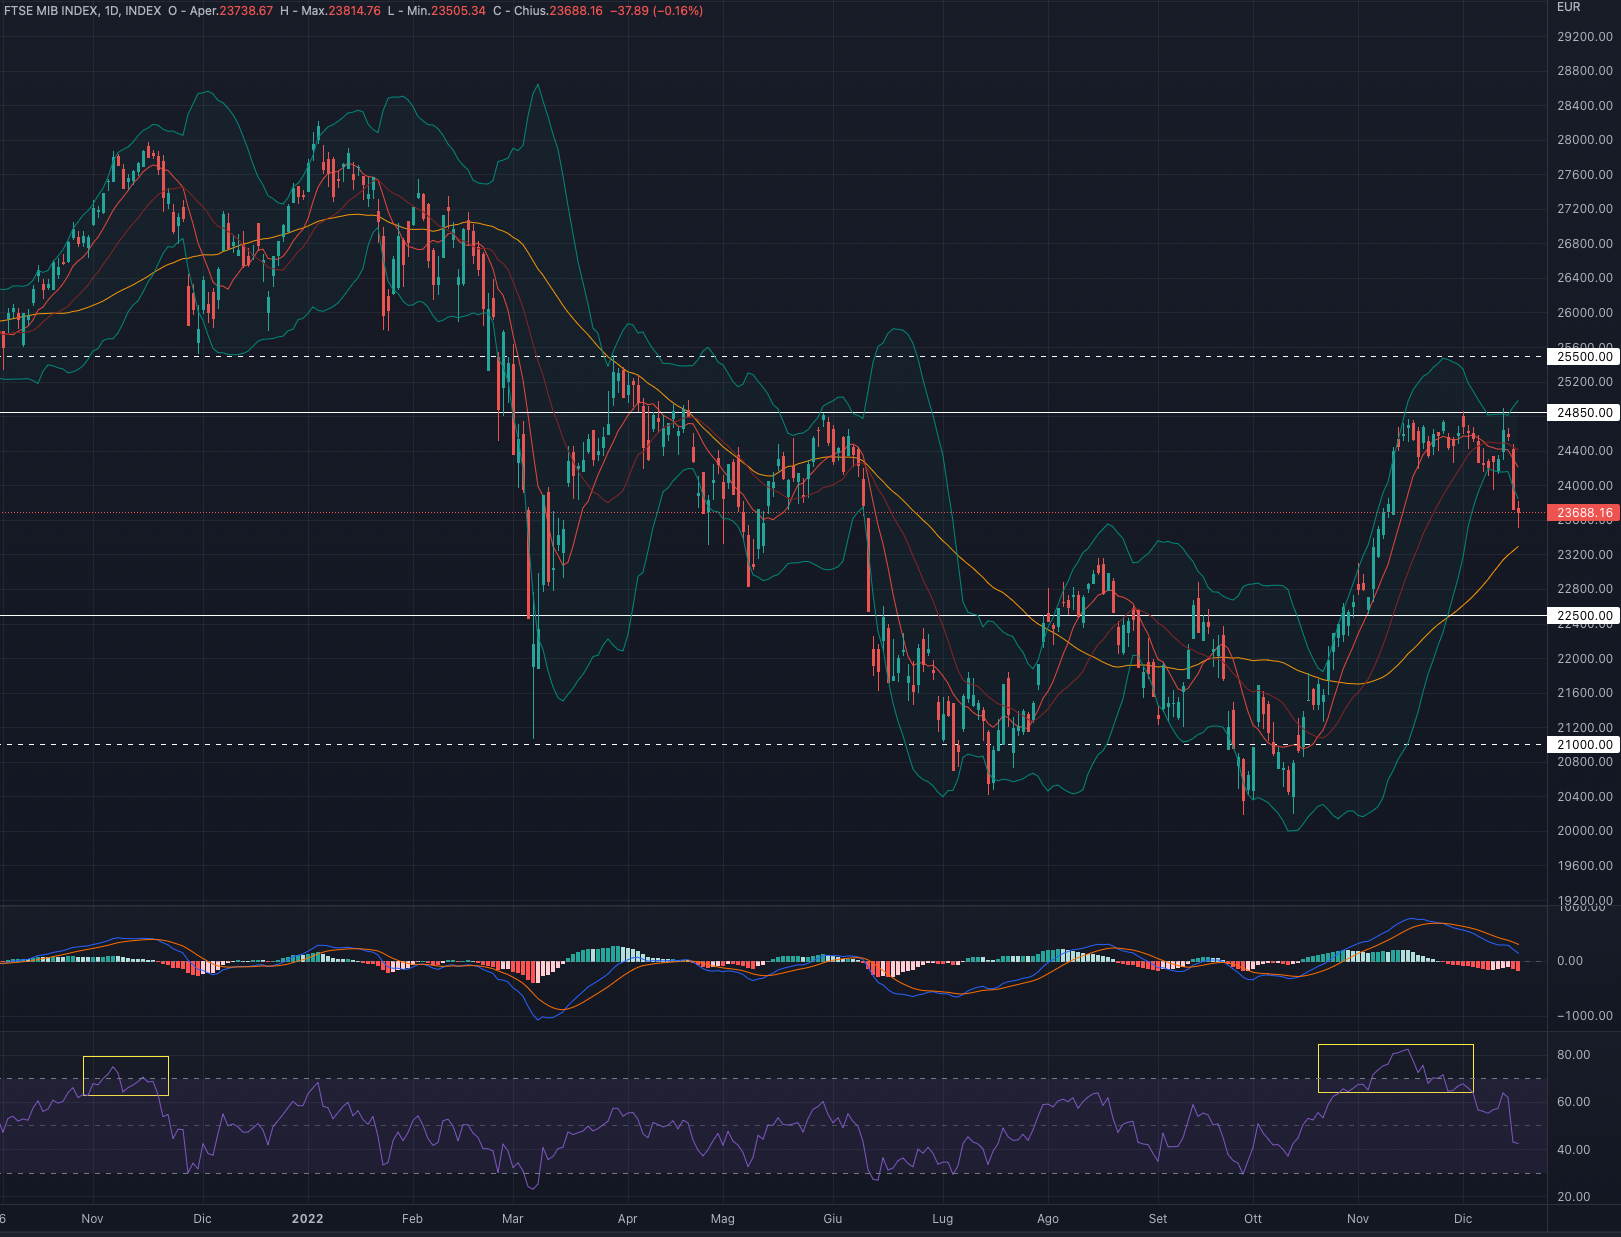
The FTSEMIB index had a week down by -2.43%.
For the week ahead we favour a consolidation in the 23,700-23,500 area.
| Current price | Forecast | S1 | R1 | S2 | R2 |
| 23,688 | Bearish/ Cons. | 22,500 | 24,850 | 21,000 | 25,500 |
Indicators
A week of marked declines for the Italian index which now sees the price very close to the 50-day average (yellow line) which we believe could slow down the downward pressure.
MACD and RSI have reversed lower with the latter in bearish territory.
We believe is very important the break of the narrow October-November trading range as could pave the way for a short-medium term bearish phase.
The exit from the Bollinger bands now plays in favour of possible very short-term increases which we believe will then be erased by further market declines.
We remain bearish on the FTSEMIB: November's strong upsides have only now begun a retracement phase and we believe that once the 50-day average is cleared at 23,200, the price will proceed lower to at least 22,500.
Support at 22,500.
Resistance at 24,850.
DAX 40 (DAX)
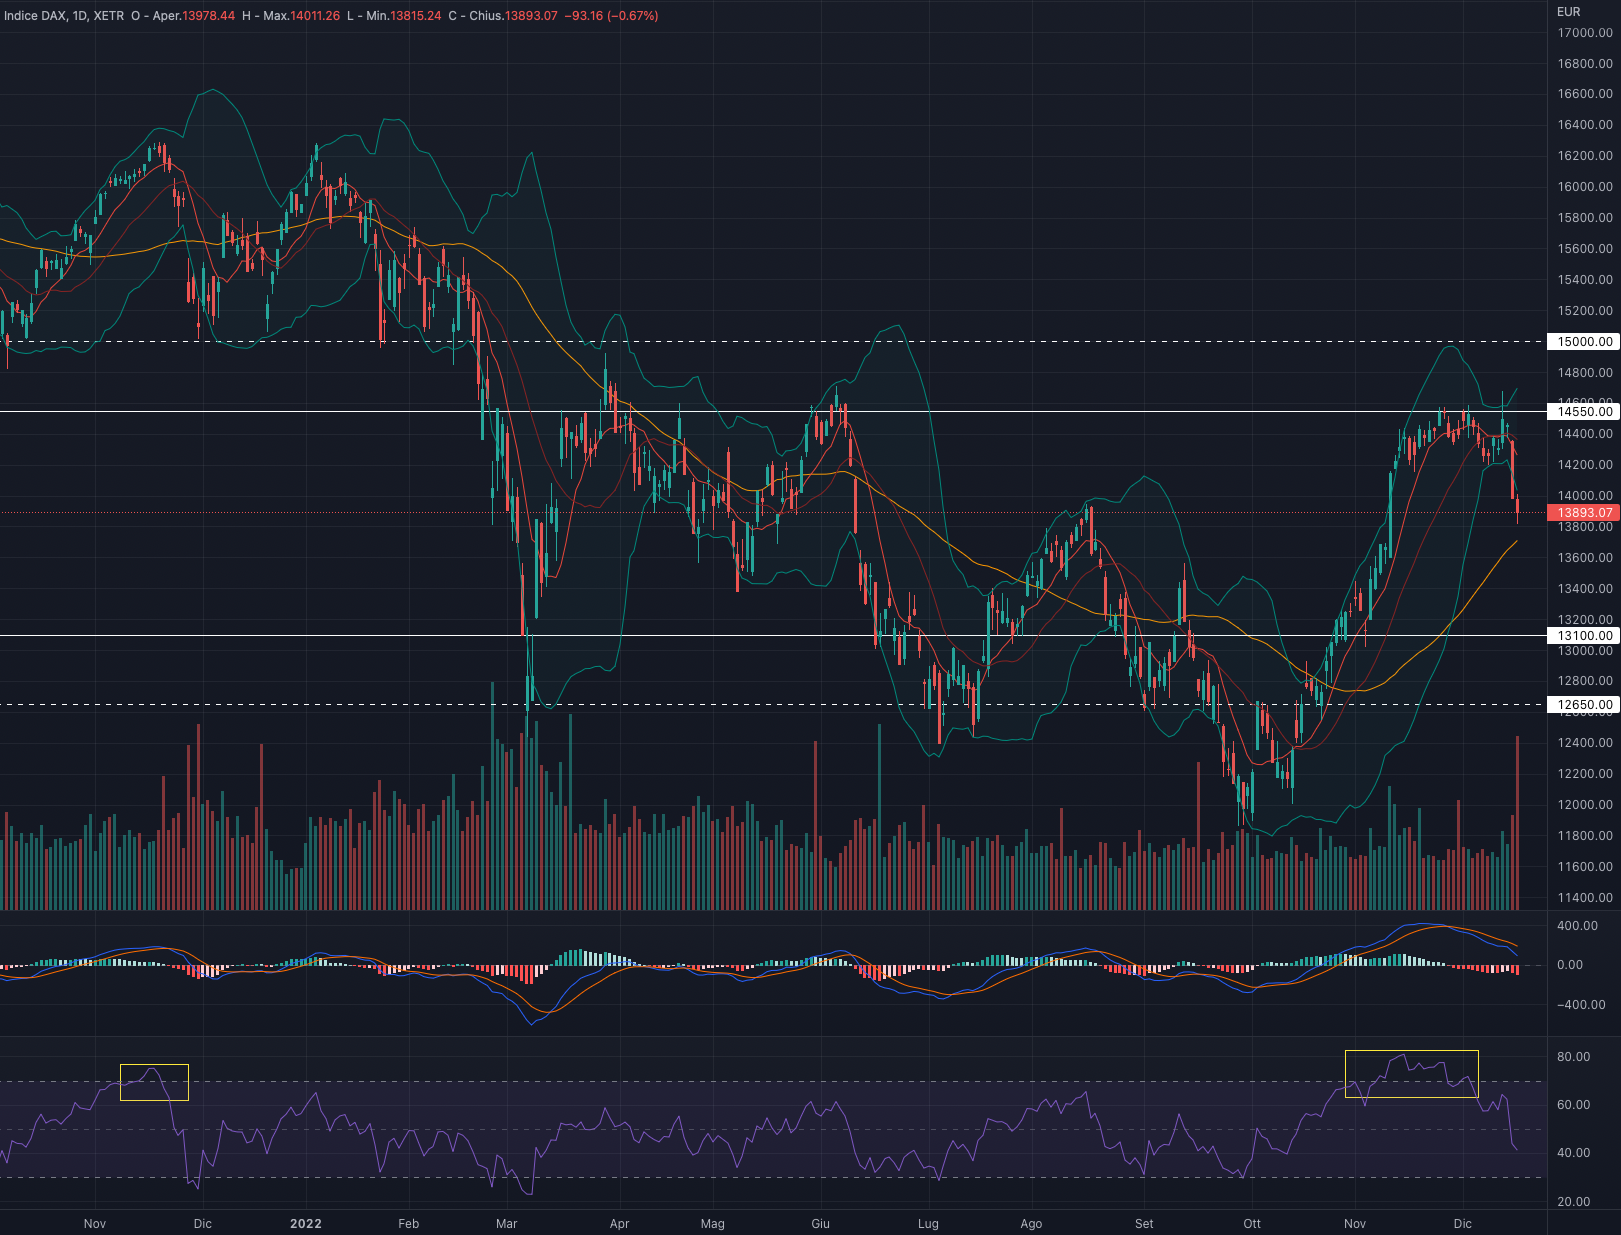
The DAX index had a week down by -3.32%.
We are in favour of a consolidation in the 13,800 area for the week ahead.
| Current price | Forecast | S1 | R1 | S2 | R2 |
| 13,893 | Bearish/ Cons. | 13,100 | 14,550 | 12,650 | 15,000 |
Indicators
Bearish week for the German index which has decisively broken the narrow trading range that began in October.
We believe this break is substantial and could pave the way for further short-medium term declines.
MACD and RSI have reversed direction with the latter in bearish territory.
We remain bearish on the DAX and in favour of possible market reversals. In the short-term we believe there may be a chance for a recovery at least to the breakout point at 14,200 to then continue lower.
Support at 13,100.
Resistance at 14,550.
S&P 500 (SPX)
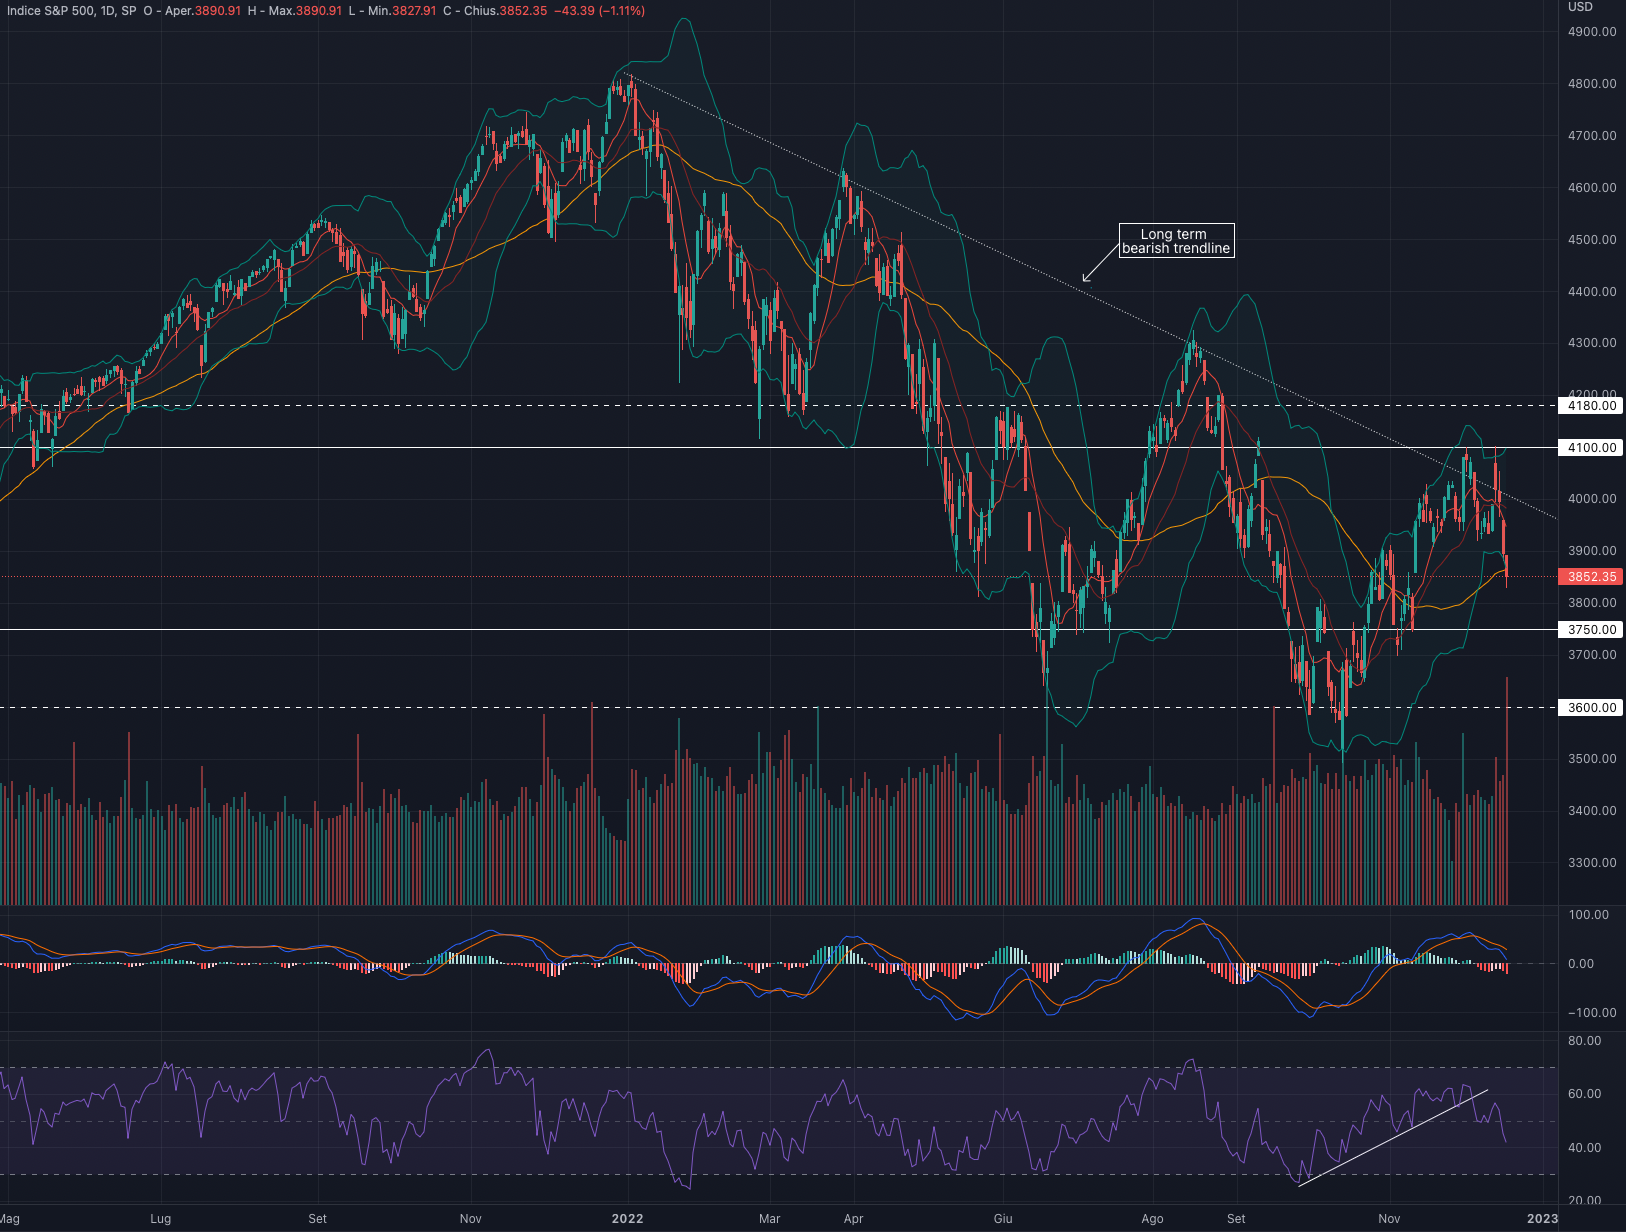
The S&P500 had a week down by -2.09%.
For the week ahead we are in favour of a possible consolidation on the 3,900 area.
| Current price | Forecast | S1 | R1 | S2 | R2 |
| 3,852 | Bearish/ Cons. | 3,750 | 4,100 | 3,600 | 4,180 |
Indicators
A week of marked declines which once again confirms the strong bearish trend that began in January 2022.
The fall below Bollinger Bands could suggest a slight pick-up, at least up to 3,950. We believe any decline may be short-lived and erased by further market bearish swings.
MACD and RSI are retracing noticeably with the latter in bearish territory.
We are bearish on the S&P 500 and prefer to wait for further market downturn until at least 3,650.
Support at 3,750.
Resistance at 4,100.
Nasdaq100 (NDX)
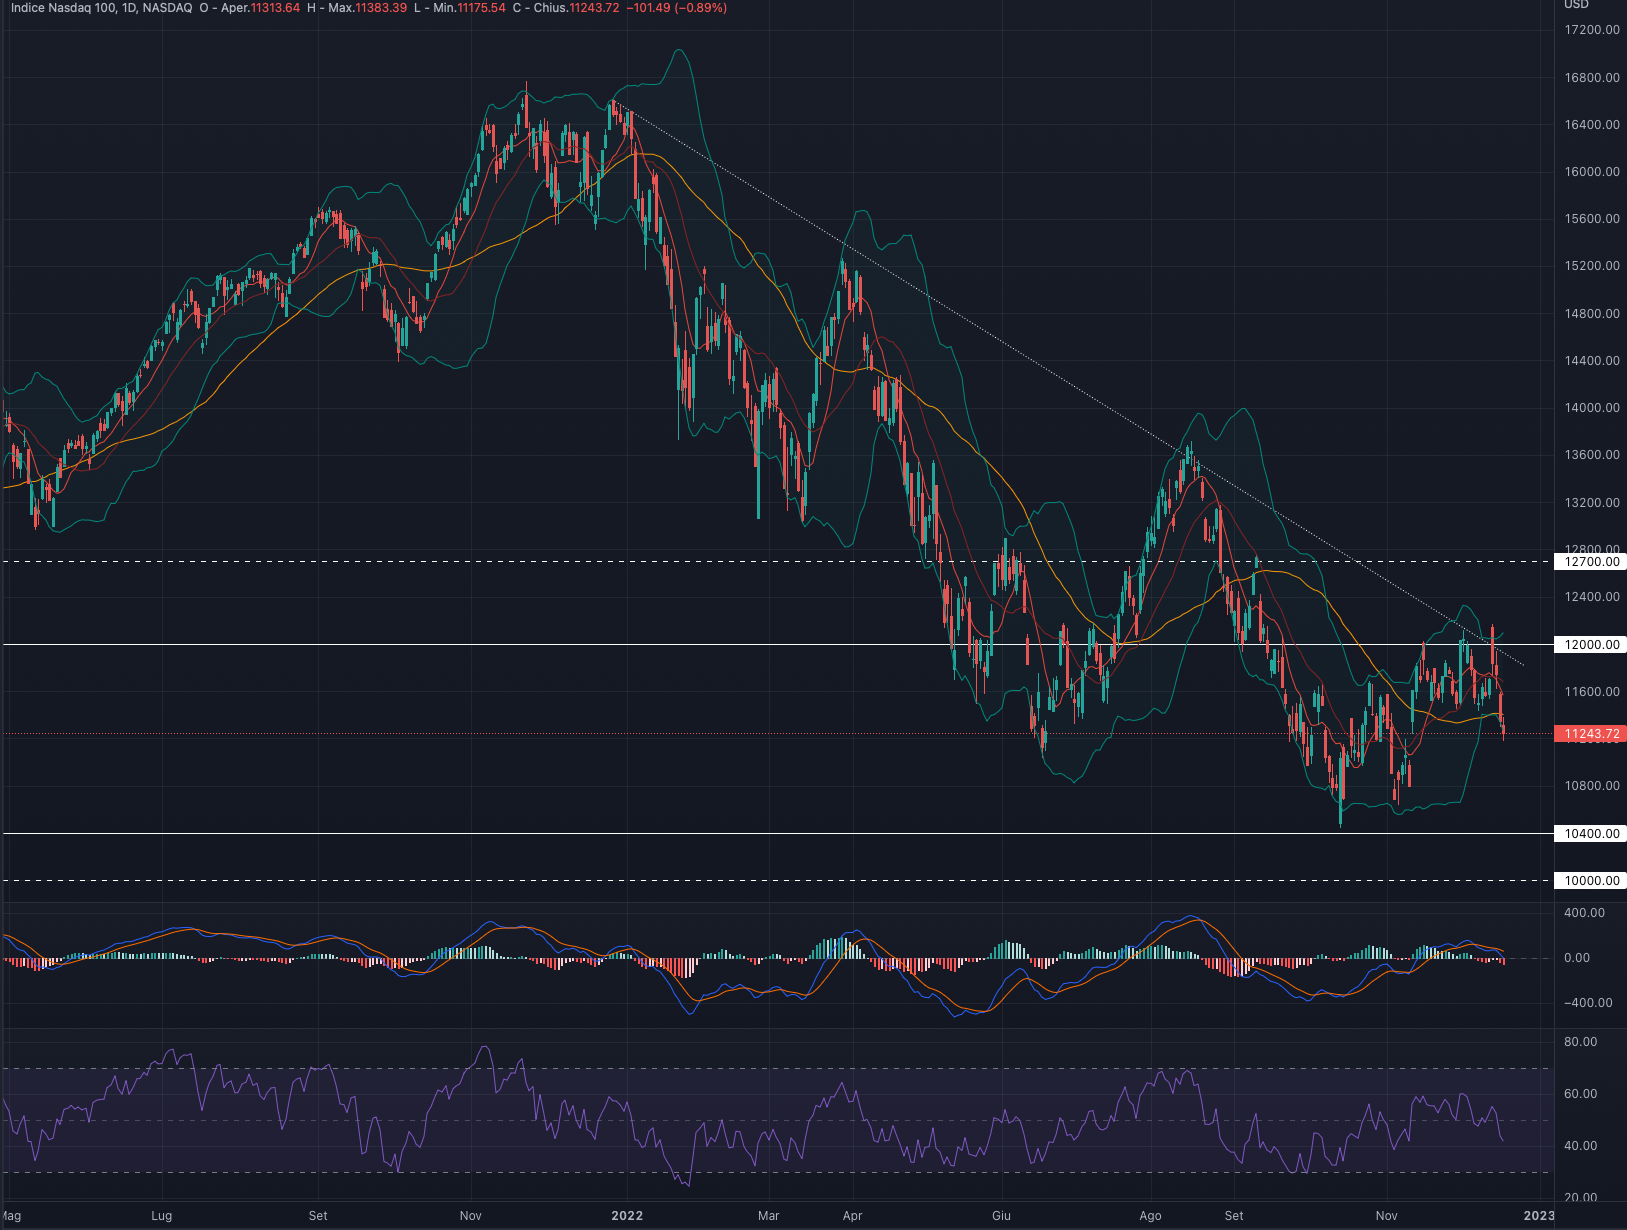
The NASDAQ 100 index had a week down by -2.76%.
We are in favour of a consolidation in the 11,500 area for the week ahead.
| Current price | Forecast | S1 | R1 | S2 | R2 |
| 11,243 | Bearish/Cons. | 10,400 | 12,000 | 10,000 | 12,700 |
Indicators
Negative week for the Tech index which has finally broken the narrow trading range started in October.
This break, combined with the fall below the 50-day average, we believe could pave the way for further medium-term declines.
MACD and RSI also signal a slowdown with the latter in bearish territory.
It is important to note that the downward trendline started in January 2022 still remains intact.
We are bearish on the NASDAQ 100. The current exit from the Bollinger Bands seems to suggest a slight pick up of momentum to then, in our view, continue the bearish pressure.
Support at 10,400.
Resistance at 12,000.
Dow Jones (DJI)
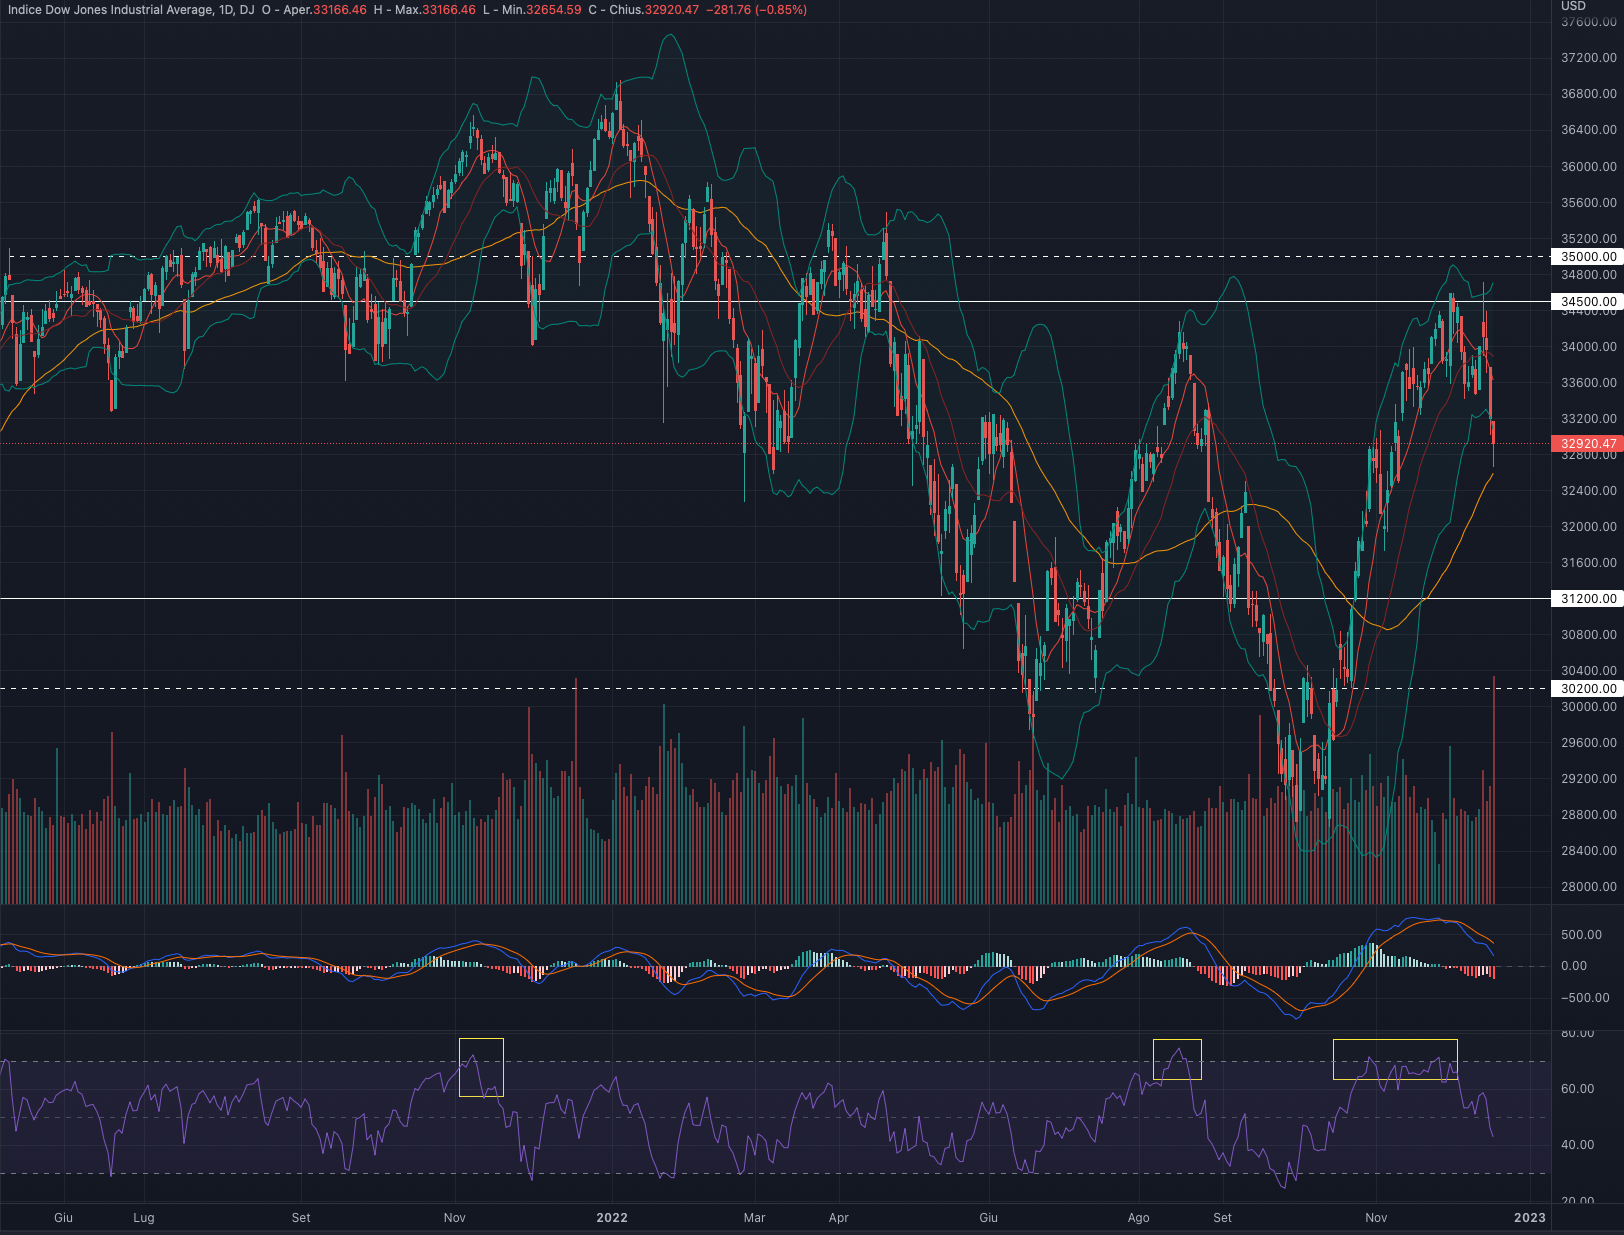
DOW JONES index had a week down by -1.66%.
We are in favour of a consolidation in the 33,000 area for the week ahead.
| Current price | Forecast | S1 | R1 | S2 | R2 |
| 32,920 | Bearish/ Cons. | 31,200 | 34,500 | 30,200 | 35,000 |
Indicators
Bearish week on the industrial index which saw the price sitting on the 50-day average (yellow line).
As for the other indices, the break of the narrow trading range of the last month we believe is very important and opens the door to more marked declines.
The price is currently outside the Bollinger Bands which could lead to a bullish swing and backtest the previous breakout point at 33,500.
MACD and RSI are in sharp slowdown with the latter already in bearish territory.
We remain bearish on the DOW JONES and until the price reaches at least 31,600 the risk/reward will remain skewed in favour of further downsides pressure.
Support at 31,200.
Resistance at 34,500.
TADAWUL (TASI)
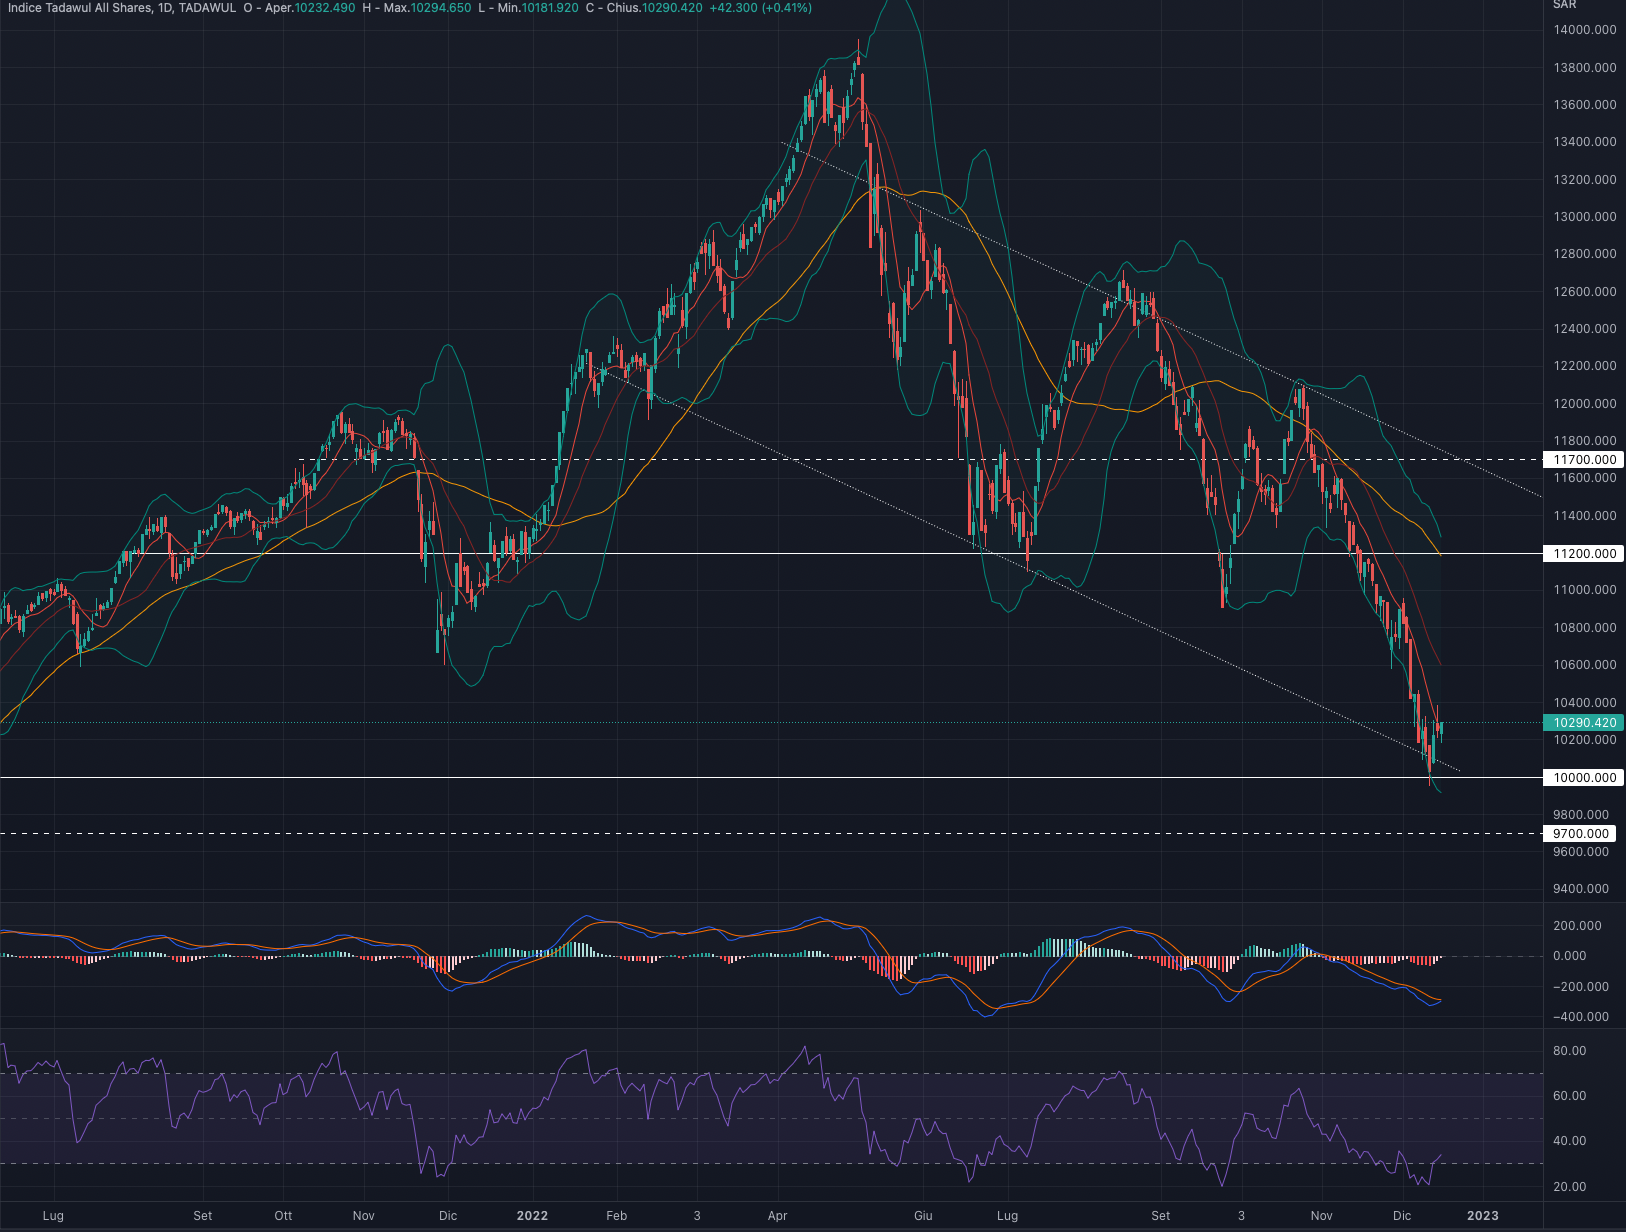
TADAWUL index had a week up by +0.43%.
We are in favour of a recovery to at least SAR 10,500 for the week ahead.
| Current price | Forecast | S1 | R1 | S2 | R2 |
| 10,290 | Bearish/ Cons. | 10,000 | 11,200 | 9,700 | 11,700 |
Indicators
Positive week for the Saudi index which seems keen to invert the direction to the upside.
As happened in November 2021, the strong distance from the 50-day average (yellow line) could suggest a possible short-term recovery. At the same time it is important to stress that the first obstacle to overcome remains the 9-day average (red line), which has played the role of dynamic resistance in recent months.
MACD and RSI are in oversold territory, decreasing the possibility of further short-term downside. MACD looks like a bullish reversal is on the move.
At the moment we prefer to remain neutral on the Tadawul. The strong downside extension makes today's swings very interesting, at the same time we believe it is worth waiting for a consolidation followed by price reversal at least above the 10,550 - 10,600 level.
Support at 10,000.
Resistance at 11,200.
FTSE ADX GROWTH MARKET INDEX (FADGI)
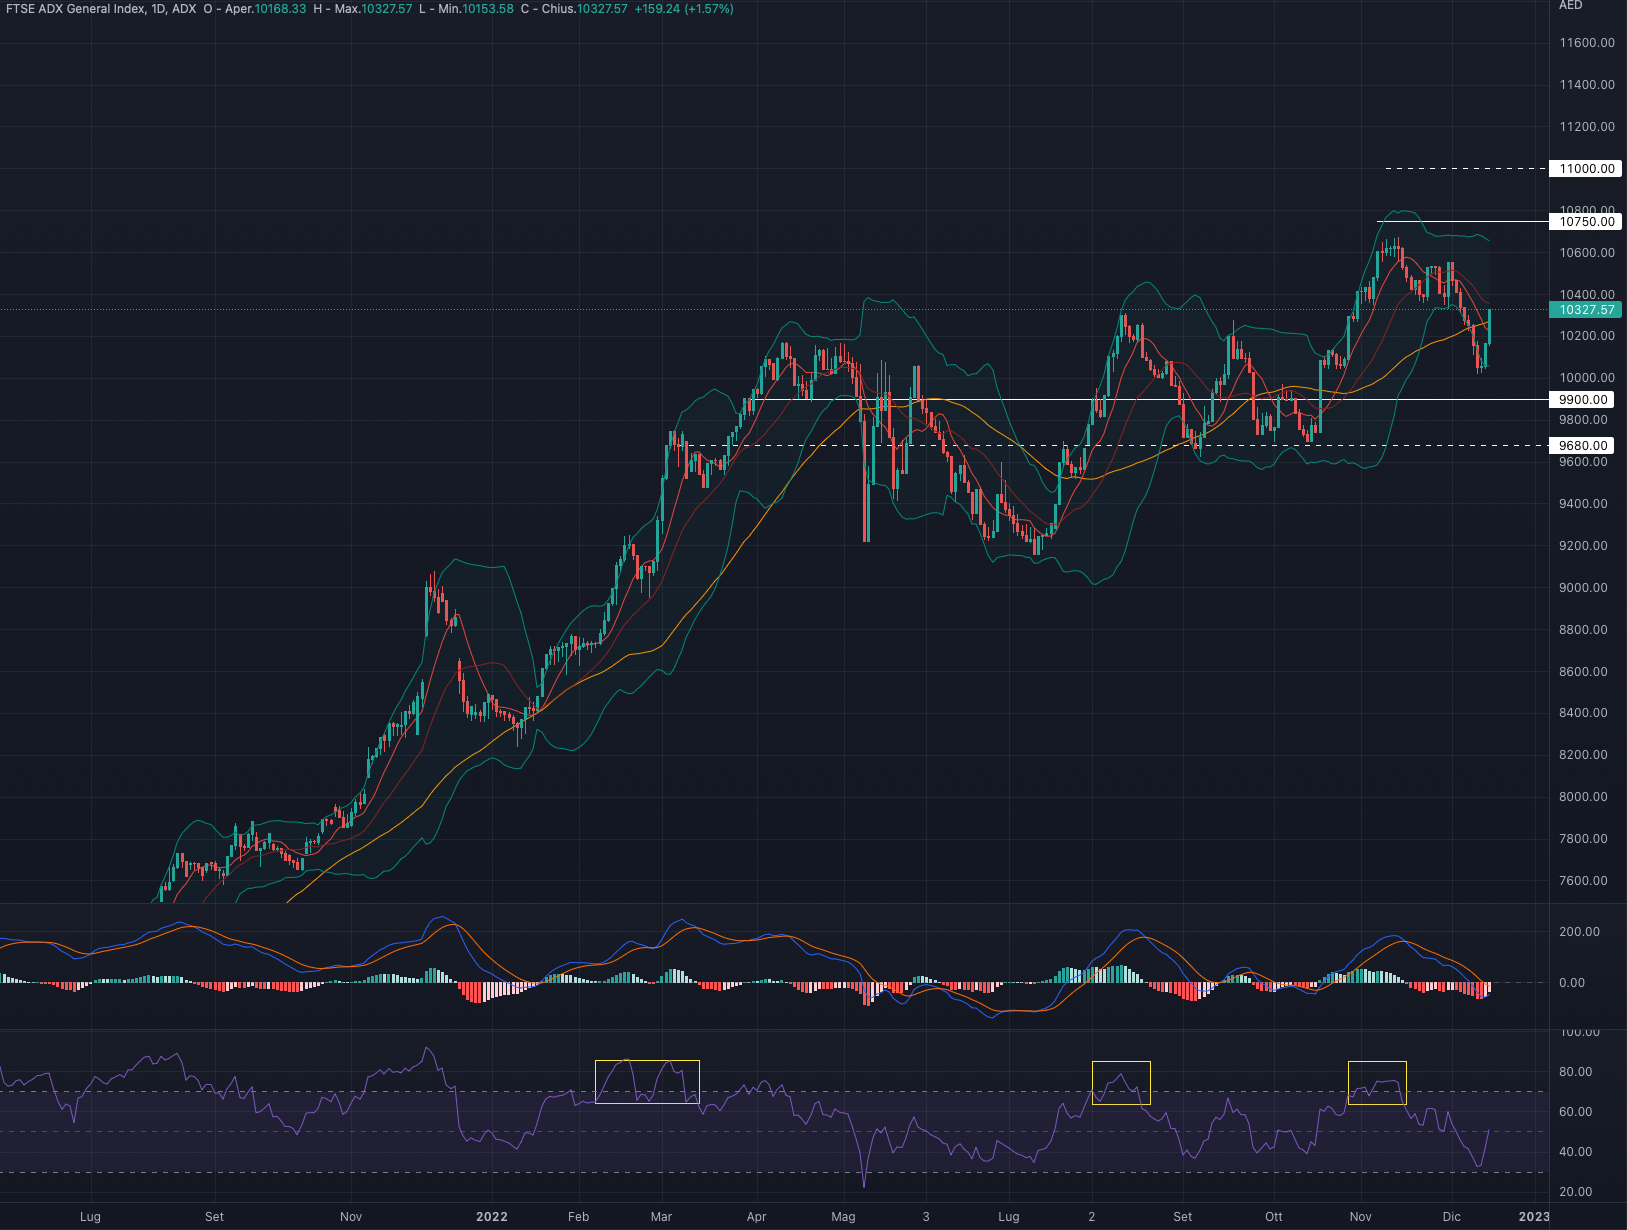
FTSE ADX index had a week up by +0.74%.
For the week ahead we favour a consolidation in the 10,350 -10,400 area.
| Current price | Forecast | S1 | R1 | S2 | R2 |
| 10,327 | Consolidation | 9,900 | 10,750 | 9,680 | 11,000 |
Indicators
Positive week that sees the price reverse its trend after a long downward series.
Breaking through the 50-day average (yellow line) is another positive indicator that could pave the way for a re-test of 10,600.
MACD and RSI mirror the price swing and are both very close to going back into bullish territory.
Specifically we prefer to wait for a consolidation in the 10,350-10,400 area and then consider long setups.
We currently remain neutral on the FTSE ADX with a short to medium term upside bias.
Support at 9,900.
Resistance at 10,750.
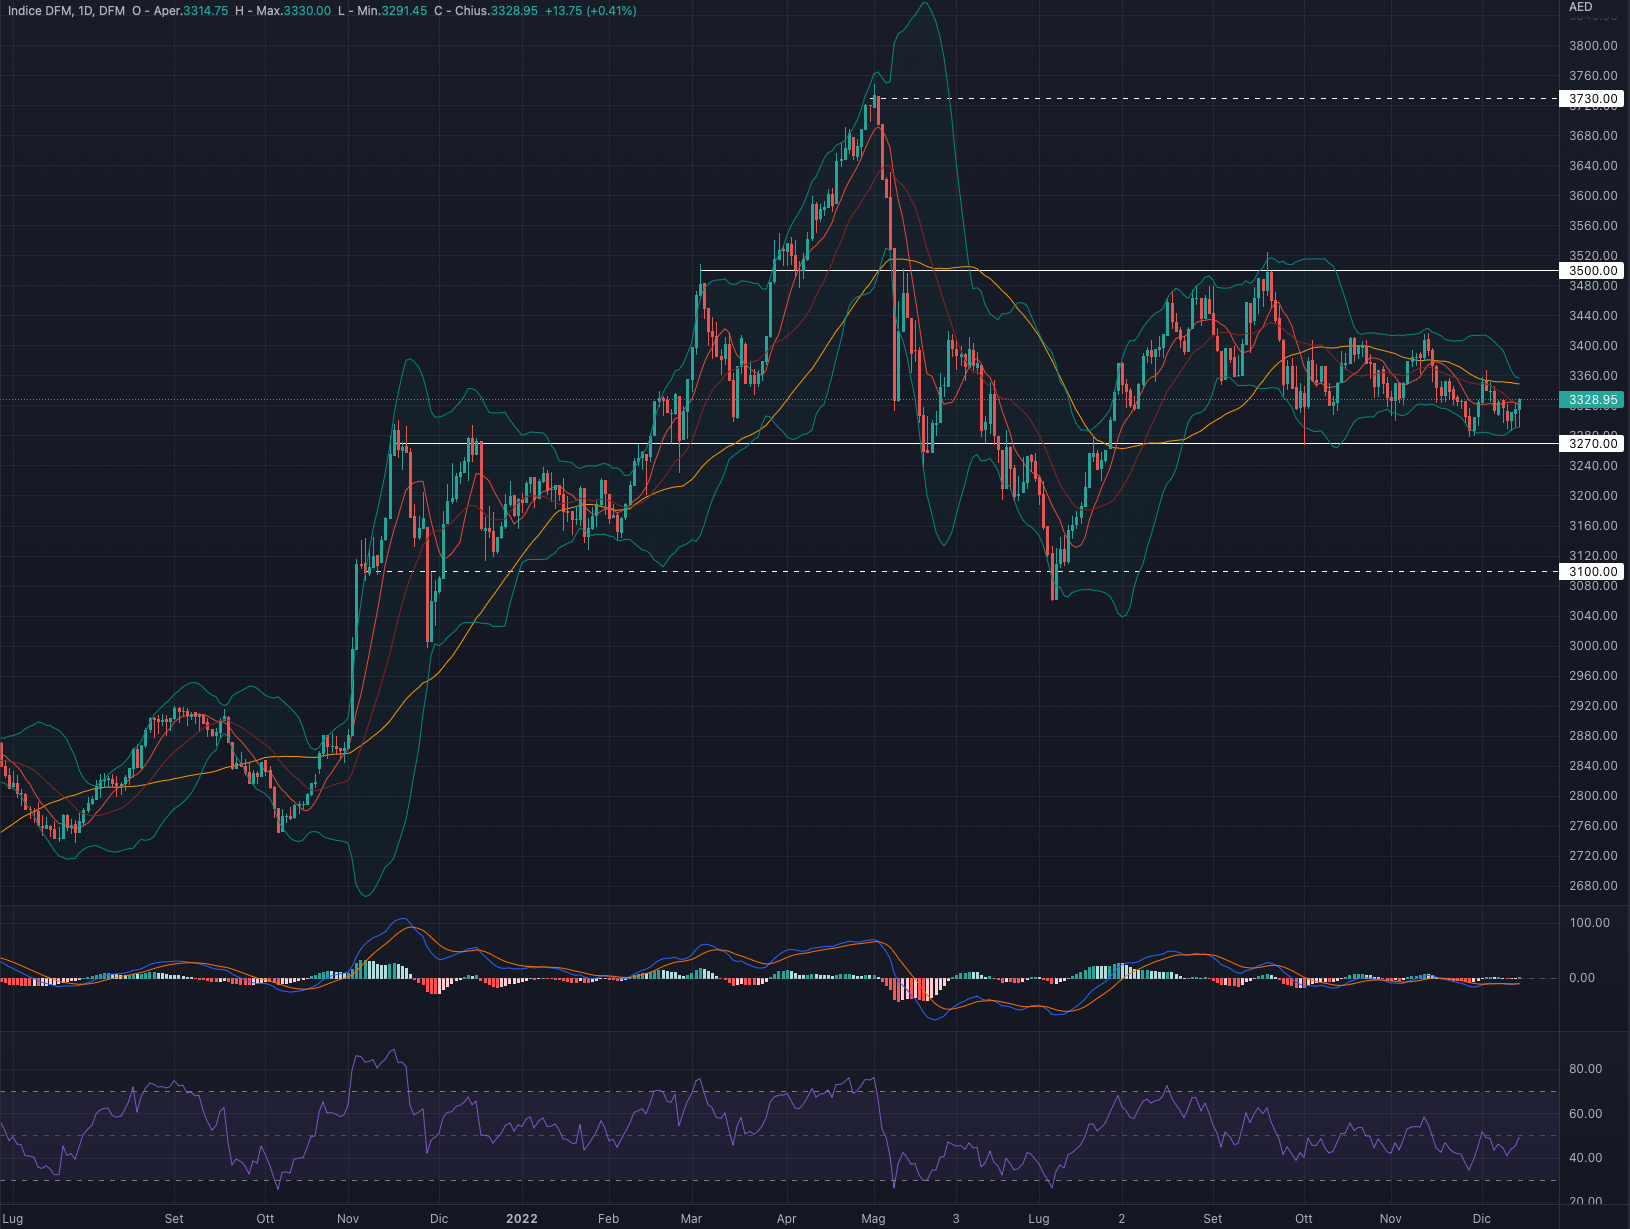
DUBAI FINANCIAL MARKET GENERAL INDEX (DFMGI)
DFM index had a week up by +0.12%.
For the week ahead we are in favour of a possible recovery to 3,380.
| Current price | Forecast | S1 | R1 | S2 | R2 |
| 3,328 | Cons./ Bullish | 3,270 | 3,500 | 9,700 | 11,700 |
Indicators
A week of substantial consolidation for the DFM.
Since mid-September, the index has continued to fluctuate within the same trading range of 3,300-3,400, giving no particular direction in the short to medium term. MACD and RSI both seem to suggest an imminent recovery; while the former indicator is essentially flat, the latter is now moving away from the oversold area.
We currently remain neutral on DFMGI waiting for a break of one of the two levels at 3,330 or 3,400 .
Support at 3,270.
Resistance at 3,500.
Author

Francesco Bergamini
OTB Global Investments
Francesco, BSc Finance and Msc in Business Management, graduated with Merit, is a professional with experience in the financial services industry and a keen interest in the financial markets.


