Fortinet Inc. Elliott Wave technical analysis [Video]
![Fortinet Inc. Elliott Wave technical analysis [Video]](https://editorial.fxstreet.com/images/Markets/Equities/Industries/Staples/pic-pexels-pixabay-256455-637435397029183920_XtraLarge.jpg)
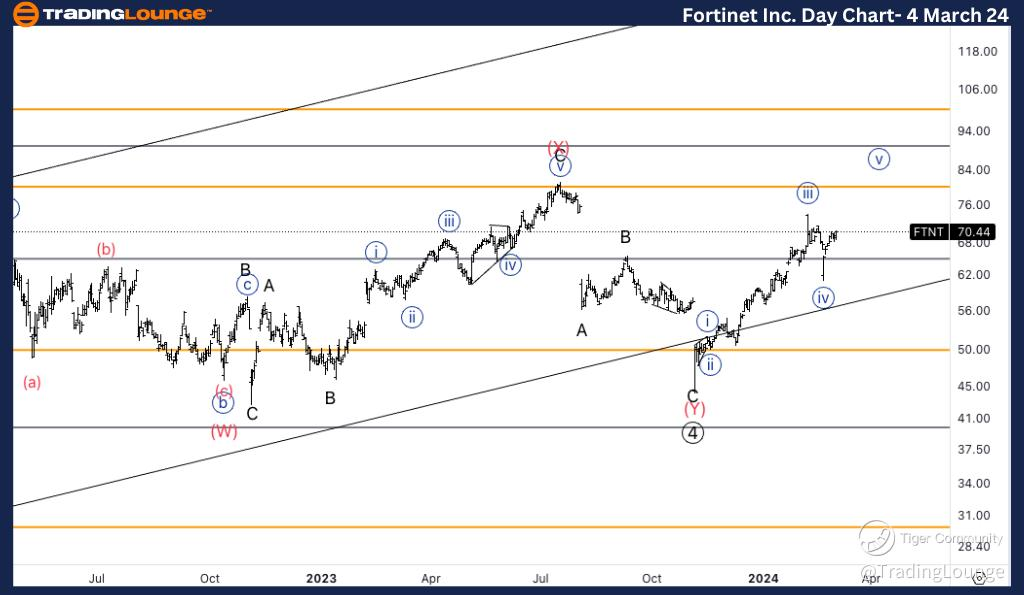
FTNT Elliott Wave Analysis Trading Lounge Daily Chart, 4 March 24.
Fortinet Inc., (FTNT) Daily Chart.
FTNT Elliott Wave technical analysis
Function: Trend.
Mode: Impulse.
Structure: Motive.
Position: Minor wave 1 of Intermediate (1).
Direction: Completion of wave {v} of 1.
Details: We seem to have completed a flat correction in Primary wave 4, and now we see to be on the way to break previous wave (X) high at around TL8 80$. We could either be in wave {v} of 1 or else wave {iv} could be higher degree wave 2.
Technical Analyst: Alessio Barretta
FTNT Elliott Wave technical analysis – Daily chart
Our analysis reveals a trend function with an impulse structure, characterized by a motive pattern. Currently positioned in Minor wave 1 of Intermediate (1), we observe the potential completion of wave {v} of 1. Following a flat correction in Primary wave 4, we anticipate a breakout above the previous wave (X) high, approximately around TL8 $80. The ongoing wave could either be wave {v} of 1 or a higher-degree wave 2 represented by wave {iv}.
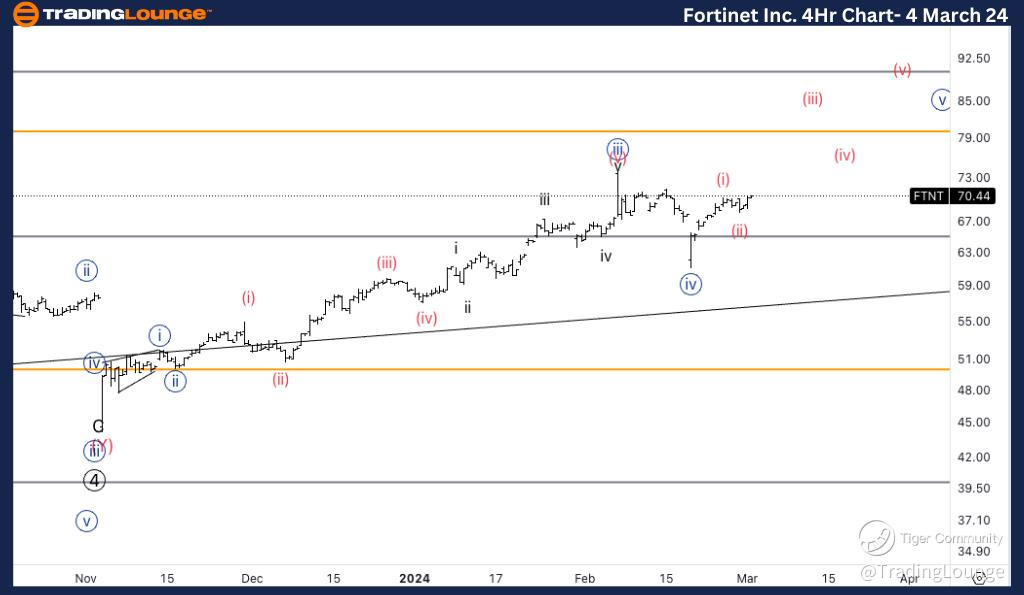
FTNT Elliott Wave Analysis Trading Lounge 4Hr Chart, 4 March 24.
Fortinet Inc., (FTNT) 4Hr Chart.
FTNT Elliott Wave technical analysis
Function: Trend.
Mode: Impulse.
Structure: Motive.
Position: Wave (iii) of {v}.
Direction: Acceleration higher into wave (iii).
Details: Looking for acceleration higher into wave (iii) as we seem to be breaking previous s wave (b) top after finding support on Medium Level 65$.
Welcome to our FTNT Elliott Wave Analysis Trading Lounge, your go-to resource for comprehensive insights into Fortinet Inc. (FTNT) using Elliott Wave Technical Analysis. Let's delve into the market dynamics as of the Daily Chart on 4th March 2024.
FTNT Elliott Wave technical analysis – Four hour chart
Here, we identify a trend mode with an impulse structure, indicating a motive pattern. Positioned in Wave (iii) of {v}, we anticipate an acceleration higher into wave (iii). This expectation comes as we observe a breakthrough above the previous wave (b) top, following support found at the Medium Level of $65.
FTNT Elliott Wave technical analysis [Video]
Author

Peter Mathers
TradingLounge
Peter Mathers started actively trading in 1982. He began his career at Hoei and Shoin, a Japanese futures trading company.


