Five-swing Elliott Wave sequence in FTSE supports bullish bias [Video]
![Five-swing Elliott Wave sequence in FTSE supports bullish bias [Video]](https://editorial.fxsstatic.com/images/i/Equity-Index_FTSE-2_XtraLarge.jpg)
The ongoing rally in the FTSE Index, originating from the April 7, 2025 low, continues to unfold as a five-wave impulse structure within the Elliott Wave framework. This signals sustained bullish momentum. From the April 7 low, wave 1 peaked at 7984.19. Wave 2 pullback followed which concluded at 7599.56. The index then surged in wave 3, reaching 8902.4. The subsequent wave 4 correction manifested as a double three Elliott Wave structure, as evidenced on the 1-hour chart. From the wave 3 peak, wave (w) declined to 8809.91. It was then followed by a wave (x) recovery to 8858.56. The decline in wave (y) reached 8741.4, completing wave ((w)) in a higher degree. The rally in wave ((x)) peaked at 8831.9 before the index resumed lower in wave ((y)). Within this decline, wave (a) ended at 8757.97. Wave (b) ended at 8792.43, and wave (c) concluded at 8706.91, finalizing wave ((y)) of 4.
FTSE 60-Minute Elliott Wave technical chart
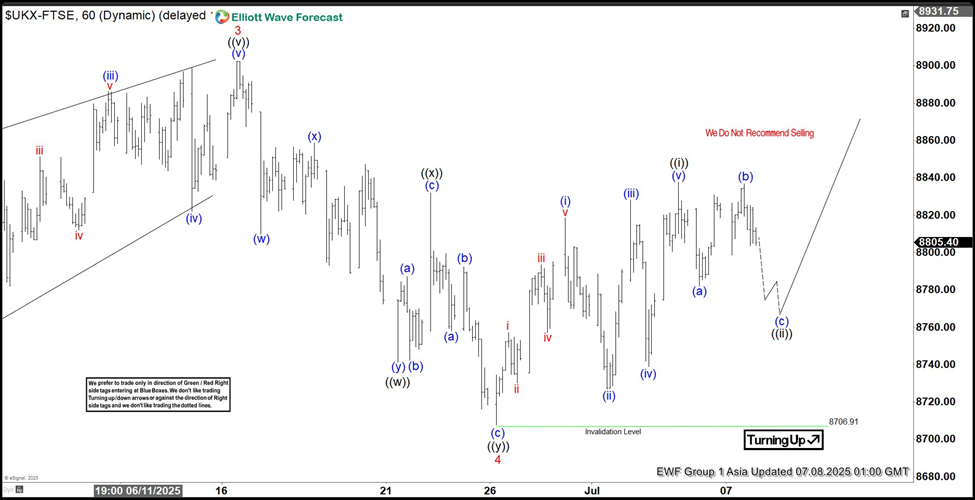
The FTSE has since turned higher in wave 5, requiring a break above the wave 3 high of 8902.4 to negate the possibility of a double correction. The structure from the wave 4 low is developing as a five-swing sequence, reinforcing the bullish outlook. From wave 4, wave (i) reached 8818.44, wave (ii) corrected to 8726.92, wave (iii) advanced to 8828.16, and wave (iv) pulled back to 8738.99. The final wave (v) concluded at 8837.75, completing wave ((i)) in a higher degree. A wave ((ii)) pullback is anticipated, likely correcting the cycle from the June 26, 2025 low in a 3, 7, or 11-swing pattern before resuming higher, provided the pivot at 8706.91 remains intact. This structure underscores a robust bullish bias, with the index poised for further upside as long as key support levels hold.
FTSE Elliott Wave technical [Video]
Author

Elliott Wave Forecast Team
ElliottWave-Forecast.com


