Fiserv stock plunges 21% on Q2 organic sales miss, lowered guidance
- Fiserv stock sinks as much as 21% on Wednesday.
- Organic sales miss consensus, and management lowers 2025 outlook.
- CEO continues to expect double-digit adjusted EPS gains.
- Trump inks deal with Japan for 15% tariff.
Fiserv (FI) stock sold off 21% on Wednesday after the payments company reported a decent second quarter that didn't live up to expectations. The company missed Wall Street's organic sales growth in Q2 and also lowered guidance for organic sales for the full year.
Fiserve stock traded down from a prior close near $166 to as low as $128 in Wednesday's morning session.
The pessimistic turnaround comes even as markets advance on the Trump administration's trade deal with Japan, which cuts the tariff on the Asian ally from the earlier proposed 25% to 15%. However, the European Union has readied tariffs on $117 billion worth of US goods if the Trump administration imposes unilateral tariffs on it on August 1.
Other notable earnings sell-offs have hit Texas Instruments (TXN), -12%, and Enphase Energy (ENPH), -8%, on Wednesday. As the market braces for earnings after the close from Tesla (TSLA) and Alphabet (GOOGL), this is the first wave of poor market reactions to the Q2 season.
Fiserv stock news
The reason for negativity surrounding Fiserv stock might seem like small potatoes to most traders. Fiserv's organic revenue for Q2 rose 8% YoY to $5.18 billion, just a hair beneath the Wall Street expectation of $5.2 billion.
However, many stocks are getting hit hard by the market for lackluster results due to the market trading at new all-time highs. That does not apply to Fiserv stock though, which had already tread 30% lower since early March highs before Wednesday's drop.
But coming after Q1 organic growth of 7%, the 8% Q2 figure led management to condense its full-year outlook from 10%-12% to just 10%.
The market also ignored that management raised the lower bound of its full-year outlook for earnings per share (EPS) by 5 cents to between $10.15 and $10.30.
"We made several refinements to our guidance based on our year-to-date performance and current business activity levels," said longtime Fiserv CEO Mike Lyons. "We are encouraged by our strong pipeline, recent client wins, and the quality of our strategic initiatives, and expect to deliver Fiserv’s 40th consecutive year of double-digit adjusted earnings per share growth."
Besides the organic revenue issue, Q2 results were fine. The company earned $2.47 in adjusted EPS on revenue of $5.52 billion. The topline was $320 million ahead of Wall Street consensus, and the bottom line was 4 cents better than projections.
Fiserv stock forecast
The Fiserv stock price has fallen back to the February 2024 levels. This is scary, but it could be a great time to take a long position. The best bet is usually to wait until a stock consolidates sideways or bases after a major tumble, cut FI stock looks different.
The daily candlestick looks like a hammer, demonstrating that buyers have pushed the share price well off its lows from the first half hour. Then there's the fact that the Relative Strength Index (RSI) is already extremely oversold at 19. If Thursday's sees an open above the Wednesday high, then it could mean that the uptrend is already underway.
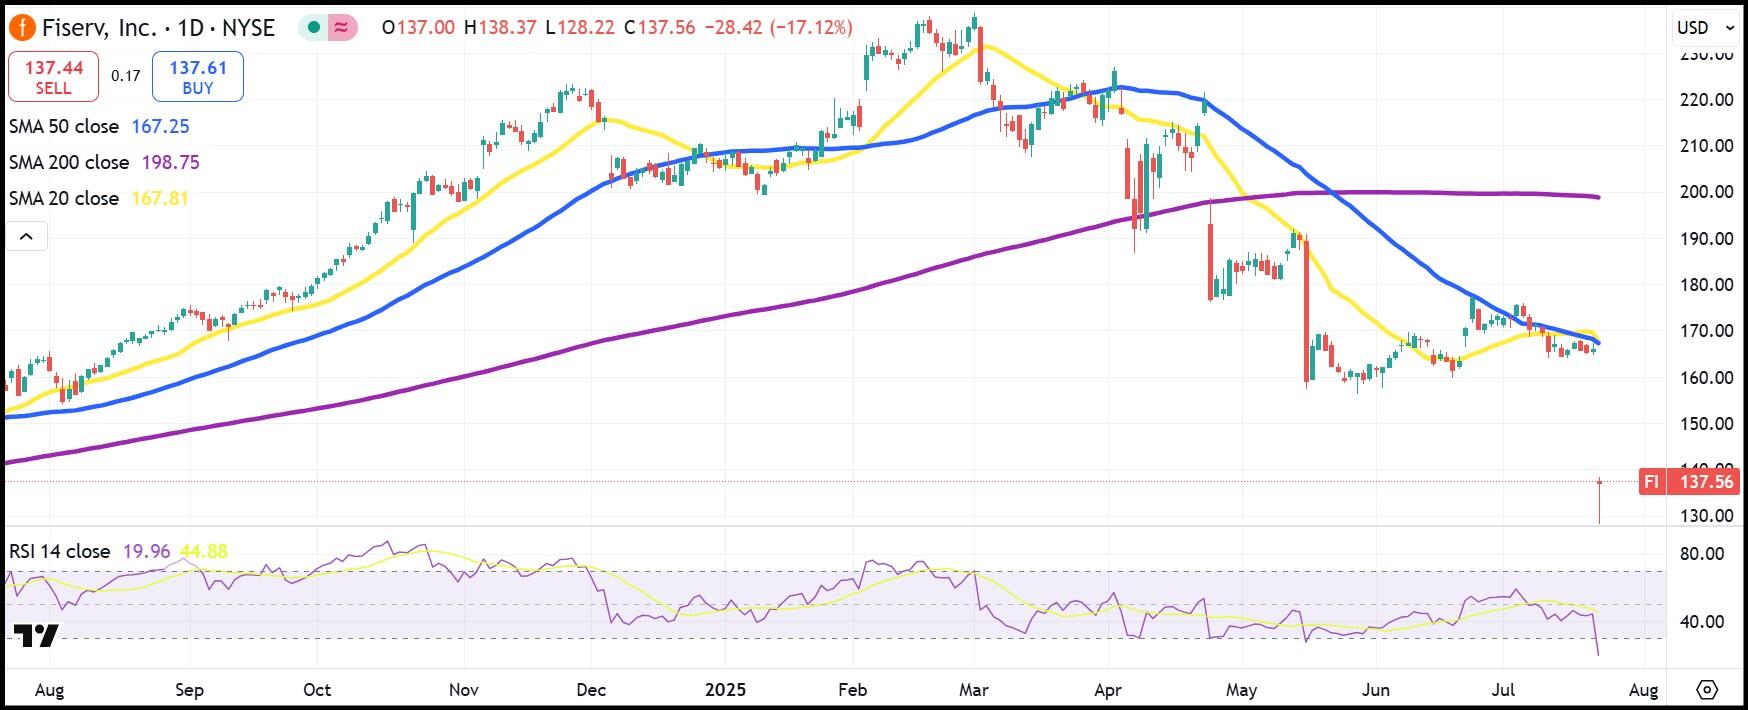
Fiserv daily stock chart
Premium
You have reached your limit of 3 free articles for this month.
Start your subscription and get access to all our original articles.
Author

Clay Webster
FXStreet
Clay Webster grew up in the US outside Buffalo, New York and Lancaster, Pennsylvania. He began investing after college following the 2008 financial crisis.


