FAANGTastic Chart Analysis: FB, AAPL, AMZN, NFLX, GOOGL, TSLA key daily technical levels
- TSLA shares on course for sub-$500.
- AMZN due a bounce if shares can hold key support at $3,120.
- AAPL heads for 200-day moving average bear target.

Markets are under pressure, and in particular the tech sector has been suffering. The Nasdaq slumped yesterday by 2.6%, worse than the other leading indices. Tech stocks generally do not like higher yields. High growth stocks, which tech stocks usually are, take the prevailing interest rate to discount future anticipated cash flows to present value. The higher the interest rate the greater the discount, hence the lower the present value.
These mega-cap names do not quite fit the pattern as they do not have high anticipated future cash flows. They already have huge cash flows.
Anyway, let us dig in and see if the charts hold anything for us to make some money.
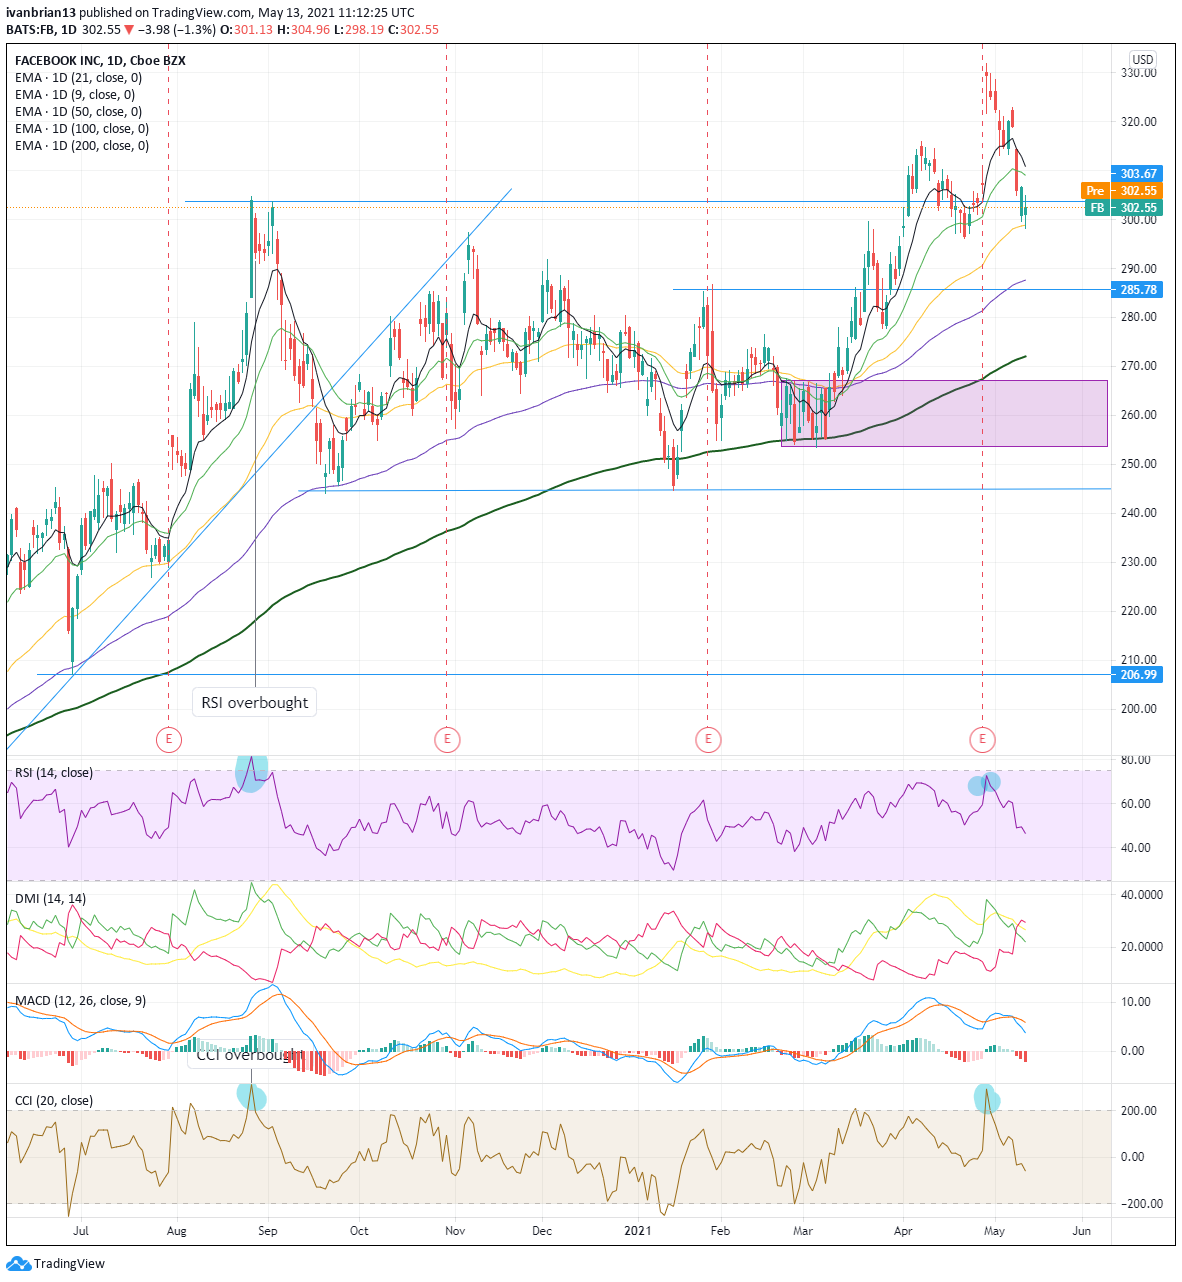
Facebook (FB) stock forecast
A perfect stall on Wednesday at the 50-day moving average. The brilliant earnings release has already been taken back, as has the previous high at $285.78. Short-term trading relies on the 9 and 21-day moving averages for sentiment, and FB is below both. Breaking the 50-day MA then targets the 100-day MA and 200-day MA at $272. This gets us close to our buy zone. FB consolidated here in March and took off. This should stall any more weakness, at least temporarily, and provide a good entry for speculative longs. The Relative Strength Index (RSI) and Commodity Channel Index (CCI) have given a nice combination of overbought signals, the last one being after Q1 2021 results.
| Support | 296 | 285.78 | 267 | 253 |
| Resistance | 303 | 315 | 321.47 | 331.81 |
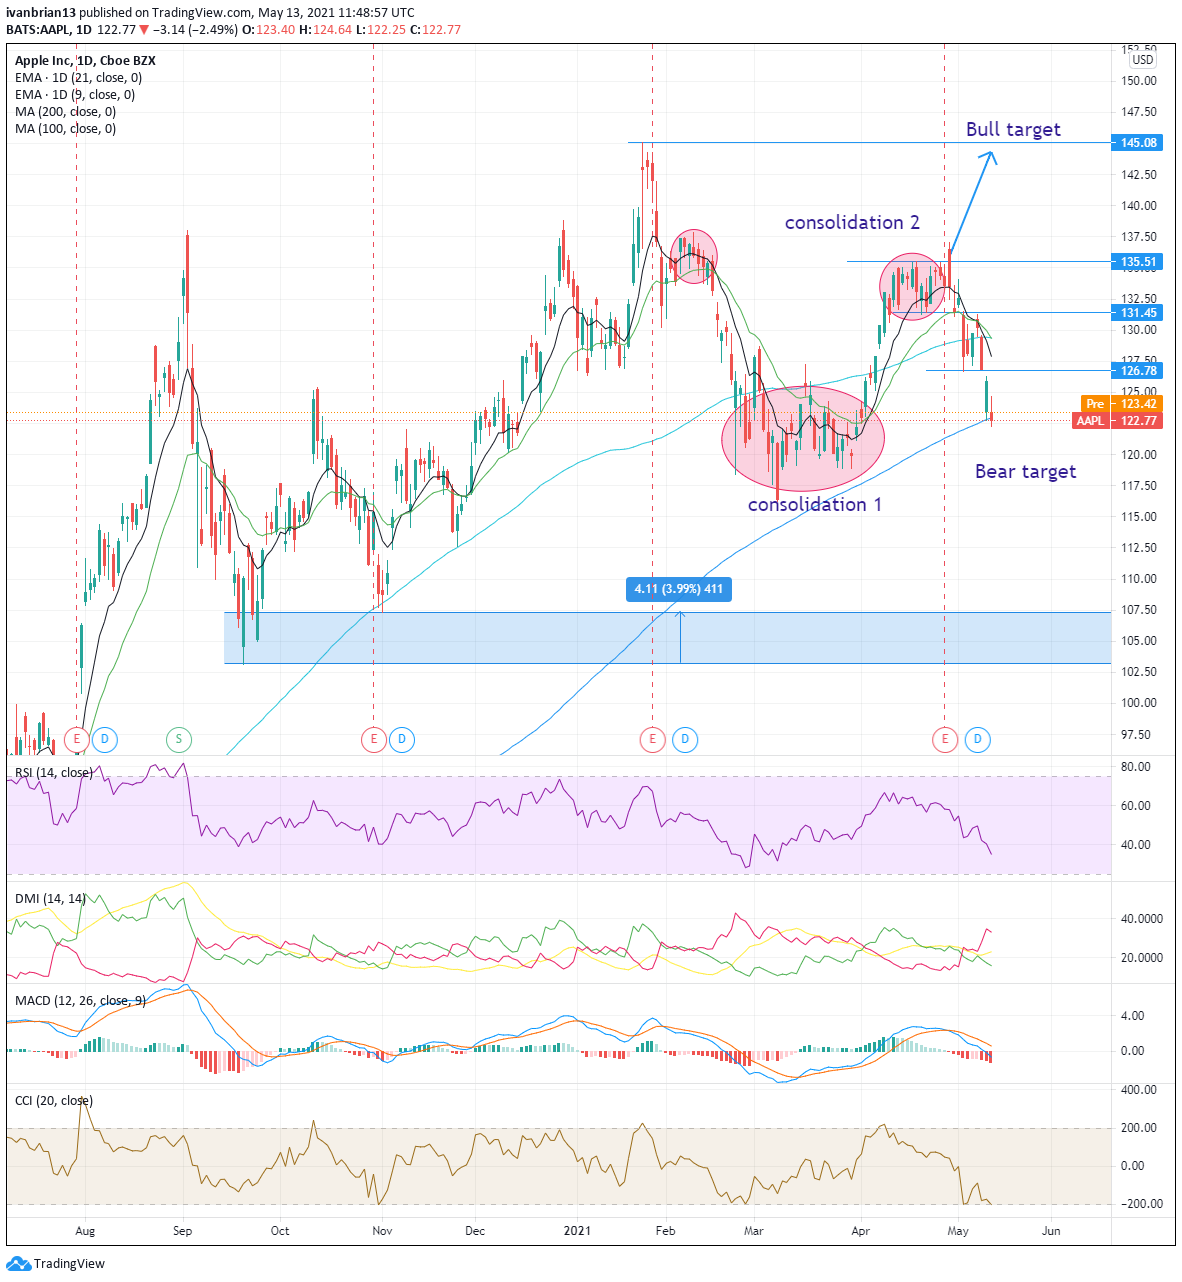
Apple (AAPL) stock forecast
Apple shares have struggled since results, amazingly enough. Now AAPL is firmly on track to hit the bear target at $120. This is a buy zone, a long area of consolidation before breaking out higher. For AAPL, this buy zone also has the 200-day MA support, which AAPL traded to yesterday. A confluence of levels or indicators increases the importance and strength of the level. Pushing above $126.78 and then the short-term moving averages are key to turning the trend bullish. The CCI is looking oversold, but no other indicator is confirming yet.
| Support | 123 pivot | 119 | 116 | ||
| Resistance | 126.78 | 129.40 weak | 131.45 | 135.51 | 145.08 |
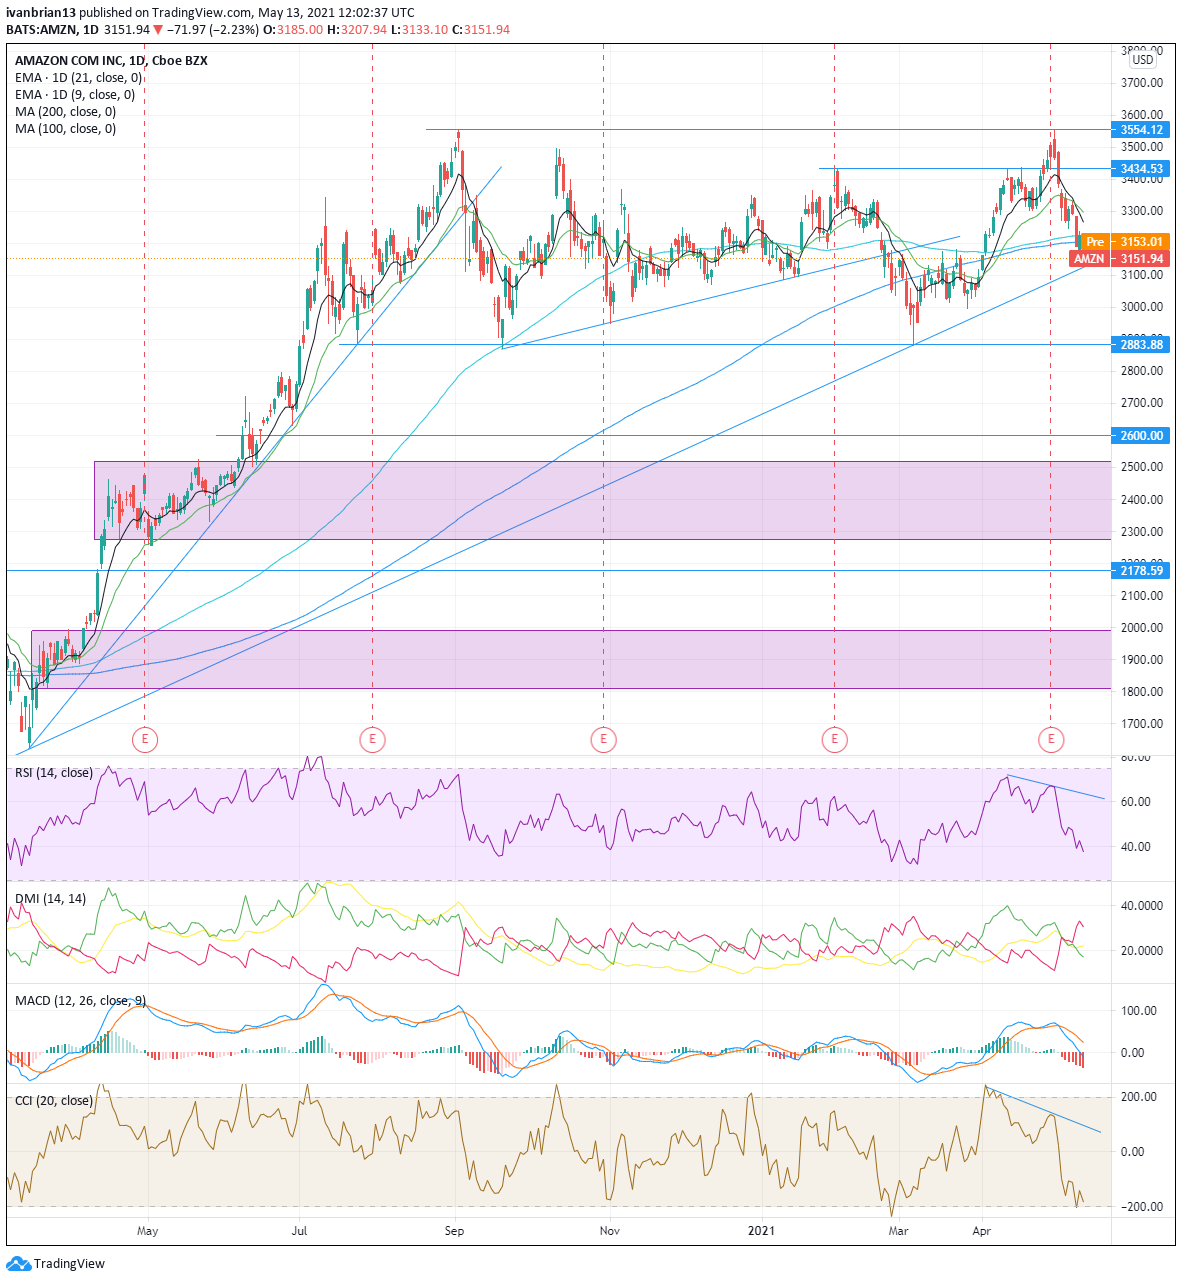
Amazon (AMZN) stock forecast
Amazon shares already broke their 200-day moving average on Monday, but this seemed to pass quietly despite Amazon's status. Everyone is talking about AAPL breaking theirs yesterday, but AMZN was the lead indicator. The highs at $3,555 did not see a matching high in either RSI or CCI, so this is a bearish divergence. Now AMZN has traded down to the long-term trend line in place since the March 2020 lows. This is a key support level of $3,131. A break here, and it could get ugly down to $2,883. Below that there is a strong buy zone at $1,800-2,000. This is a big consolidation area from March 2020 before the move higher.
Resistance is the 200-day MA at $3,200 currently. Breaking this targets the short-term MA at $3,265 and then $3,434 before a test of new highs.
| Support | 3131 key | 3000 | 2883 | 2600 | 2000 | 1800 |
| Resistance | 3200 | 3265 | 3434 | 3555 |
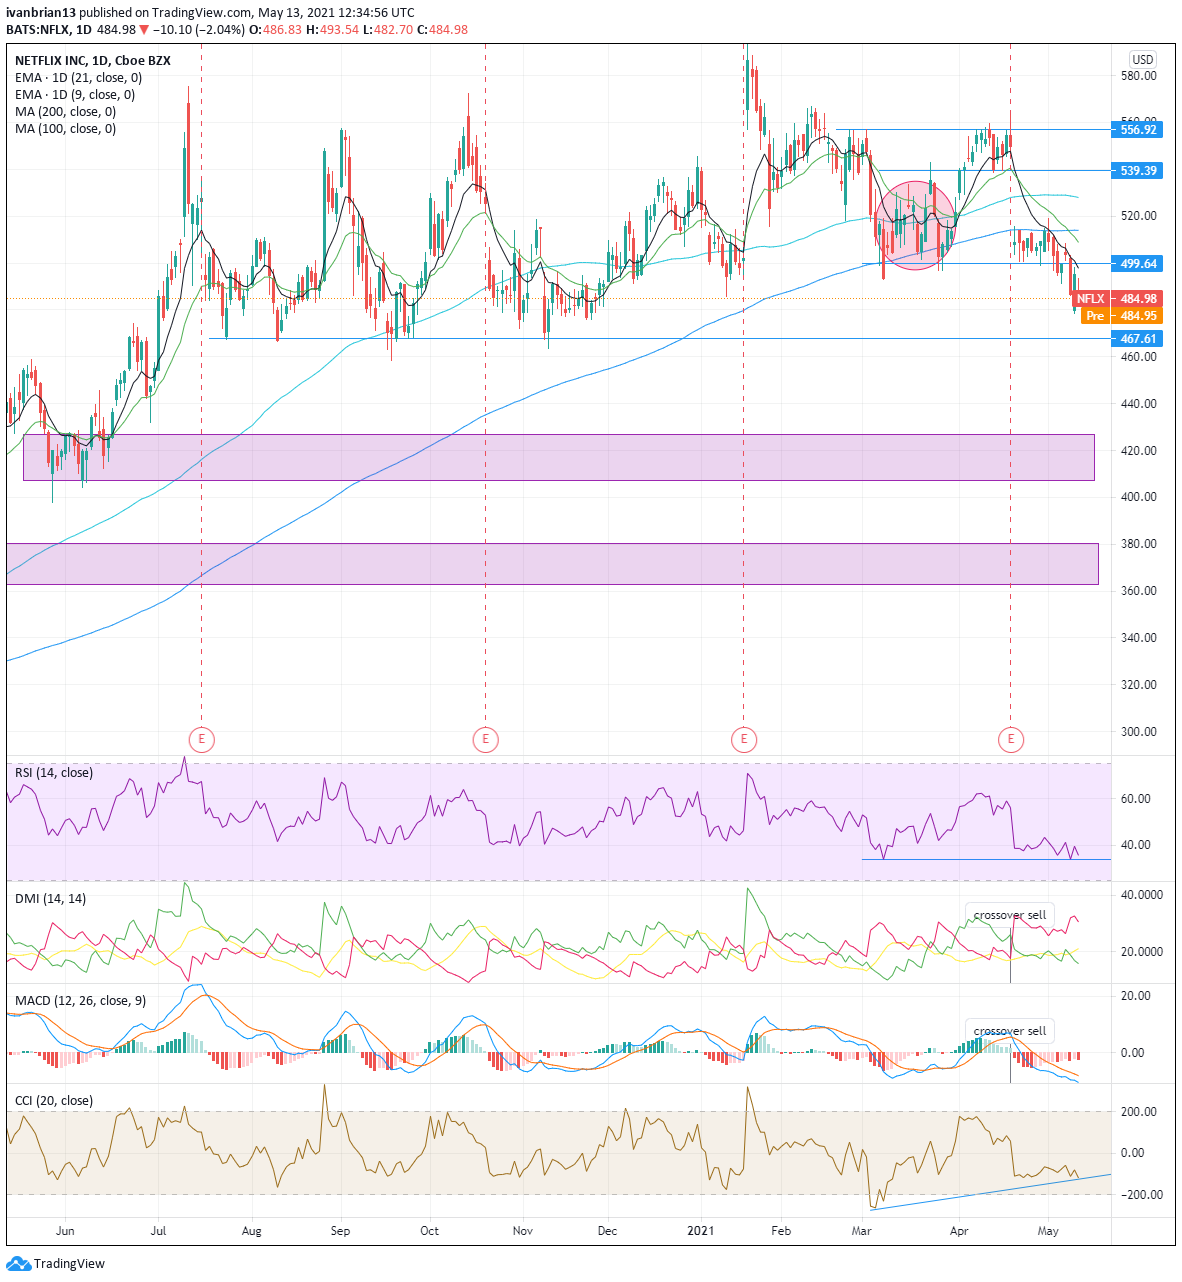
Netflix (NFLX) stock forecast
Again Netflix quietly broke its 200-day moving average on May 3 and went largely unnoticed. Now that AAPL is doing the same, all hell is breaking loose. The earnings release on April 20 created a huge gap, and we can see how well the highlighted consolidation area worked to hold the fall for quite some time. Consolidation areas show up well in market profile charts, but unfortunately we do not have access to them. It is a representation of price and time. Generally, the longer an asset spends at a price the more accepting buyers and sellers are of that price and usually more volume too. This equates to equilibrium and no sudden moves.
Now NFLX shares have broken lower and are targetting $467. MACD and DMI are in the crossover sell range. The one thing of note to watch is the CCI is not making new lows in line with the price. This may change but is a sign of a possible reversal. A break of $467 has some support around $420 from summer 2020, but the stronger buy range is at $380-360. A buy range is a consolidation area but is stronger if it continues with the trend. Reversal consolidation areas are always more dangerous and not as strong.
| Support | 467 | 420 | 400 | 380 | 360 | |
| Resistance | 499.64 | 514-200 day | 539 | 556.92 | 593.29 |
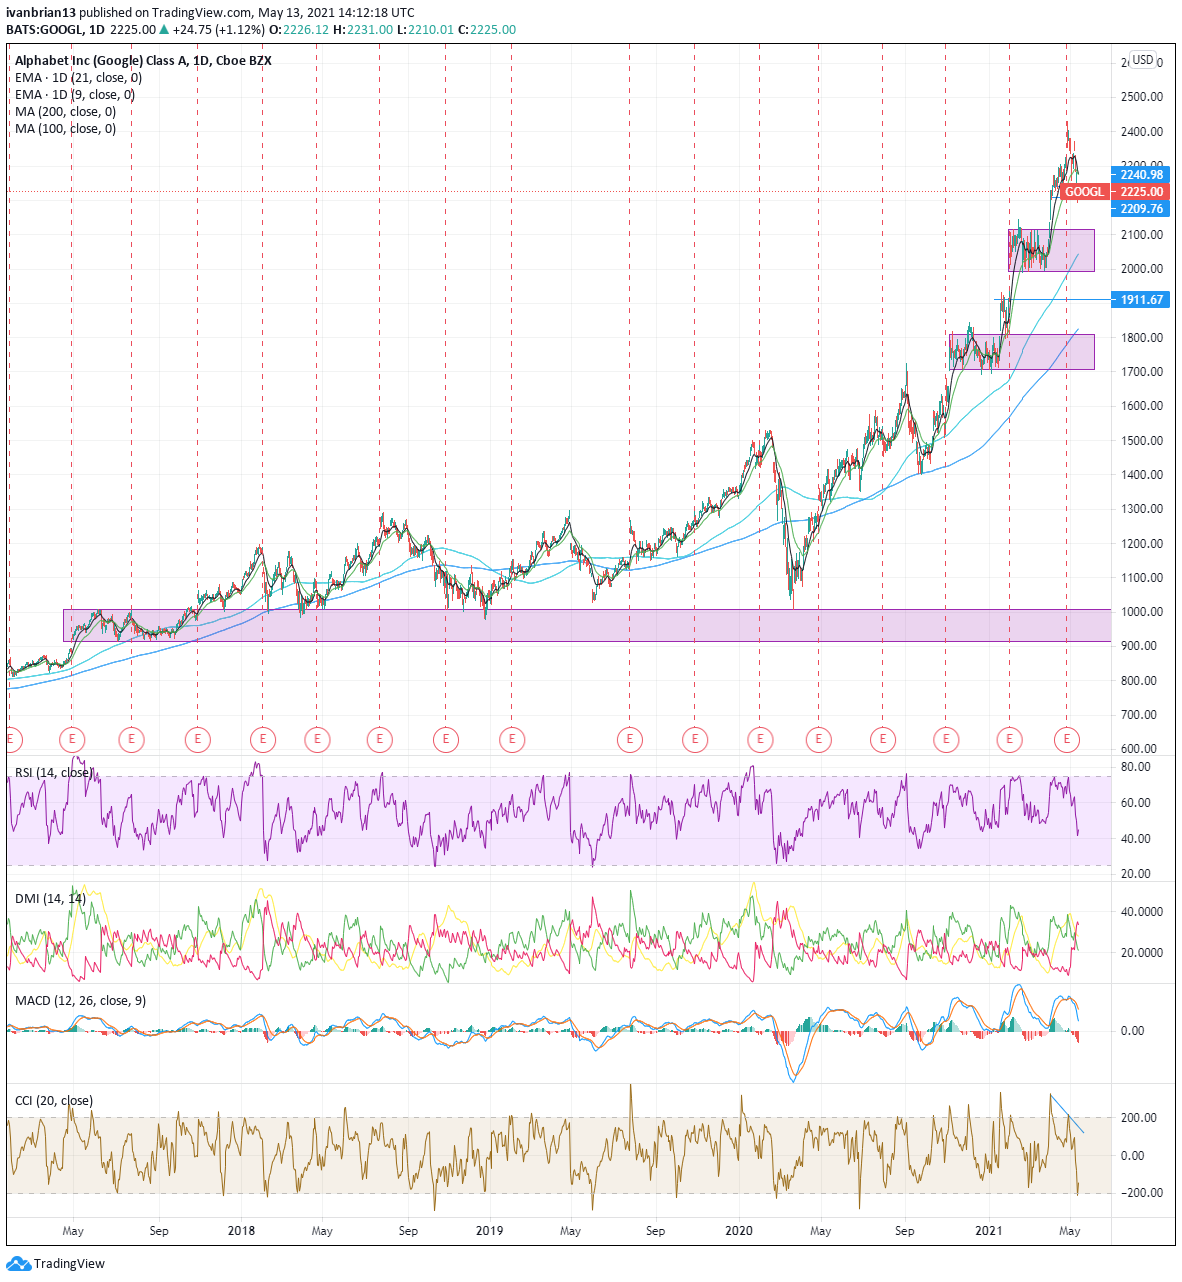
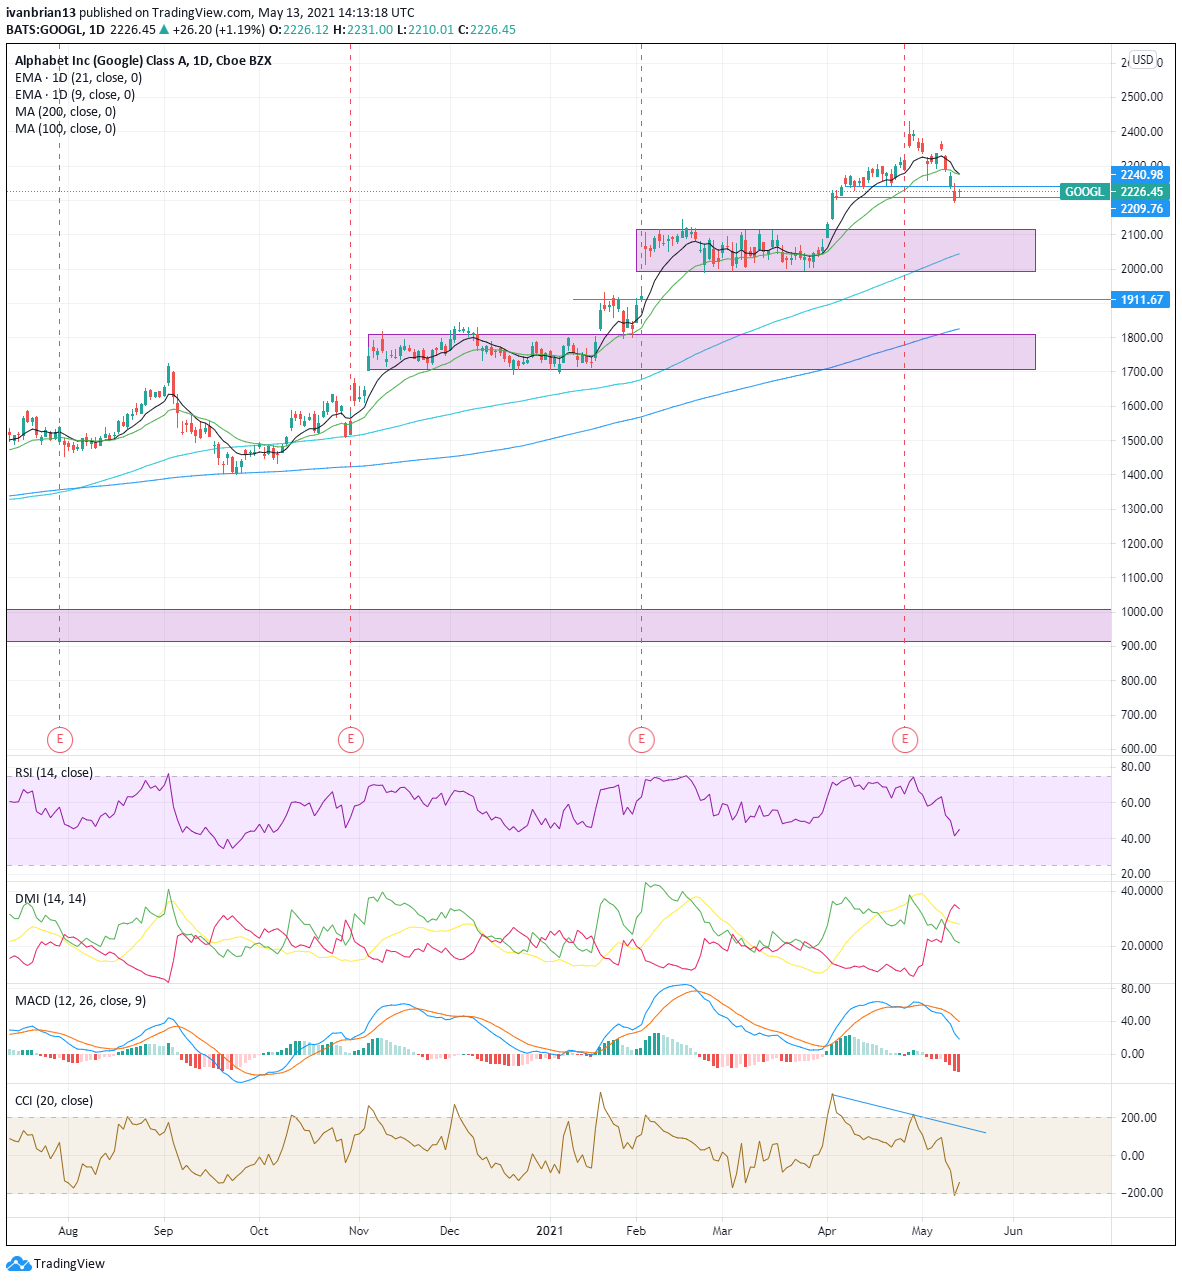
Google (GOOGL) stock forecast
I know it is really Alphabet, but seriously, does anyone call it that? Breaking $2,209, which has held the move higher since early April, is now a negative that puts GOOGL on the back foot. 9 and 21-day moving averages are trending lower and so are RSI and CCI, which are helping to confirm. MACD and DMI both crossed into bearish territory. Some very strong buy zones are in evidence at $2,100-2,000 and $1,800-1,700. Wide ranges but definitely strong regions to stop or slow price falls. The 200-day MA sits at $1,822, adding to this support region.
To turn bullish, GOOGL needs to get above $2,210 and then the short-term moving averages at $2280-90. That should see a test of highs at $2431.
| Support | 2200 | 2100 | 2000 | 1911 weak | 1800 | 1700 |
| Resistance | 2210 | 2240 key | 2280-90 | 2431 |
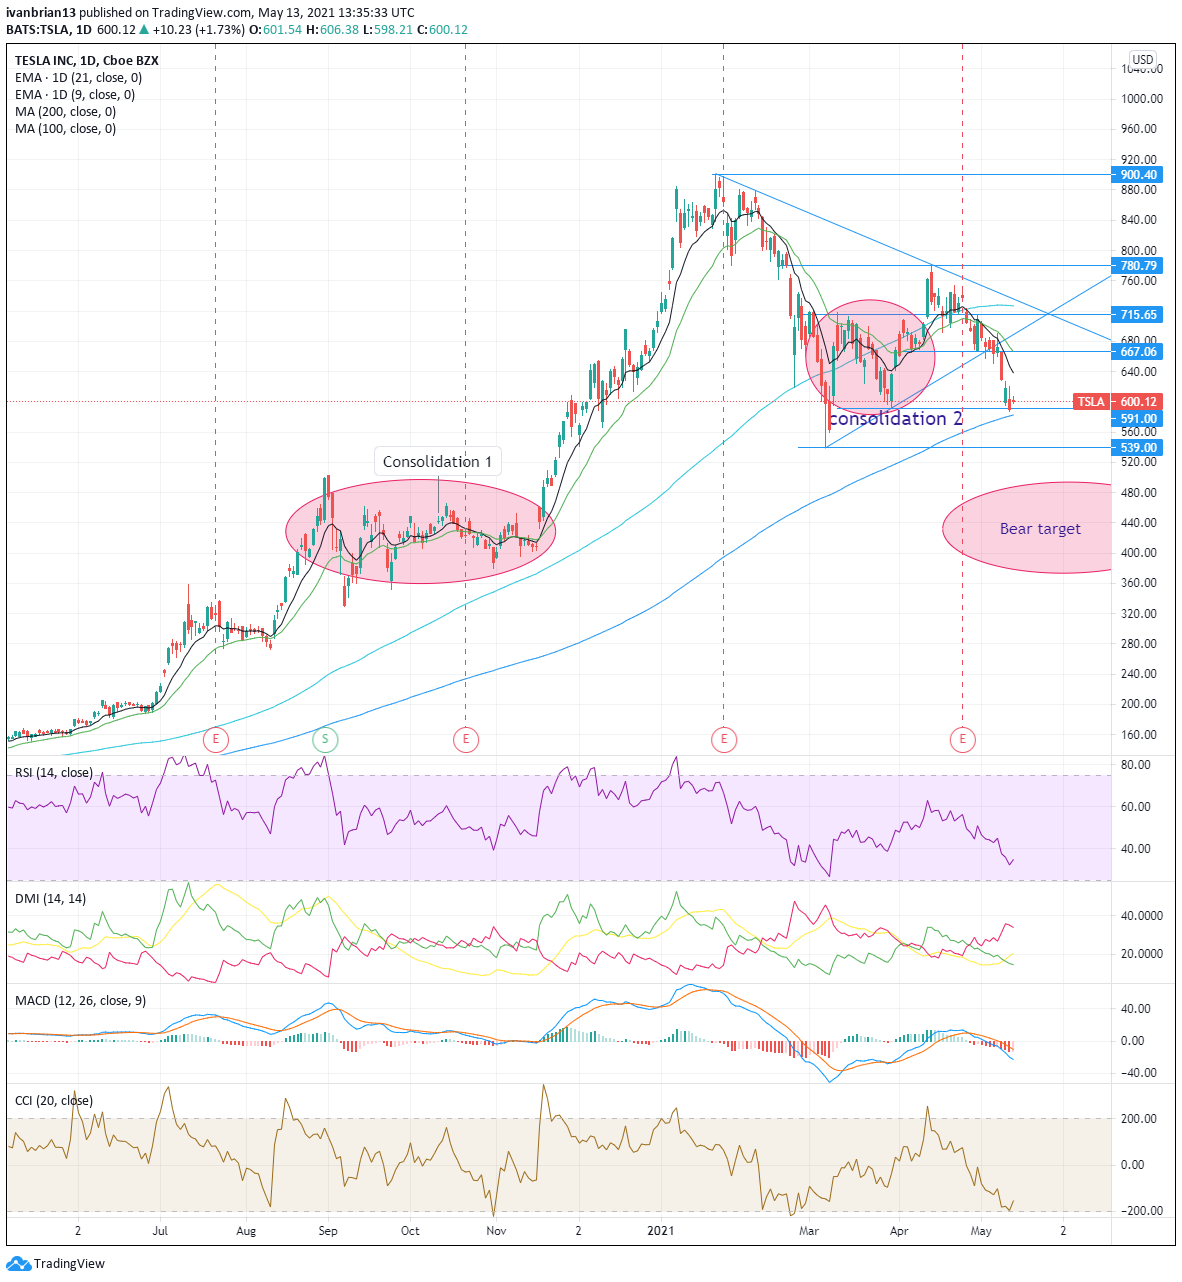
Tesla (TSLA) stock forecast
For the last one of the FAANGTastic, we save the best until last hopefully. This publisher has been calling Tesla lower to sub-$500 for some time now, and it has been working well.
Tesla is headed straight for its 200-day moving average support at $583. This and the low from March 30 at $591 may provide some interim support. If these levels go, then it is onto $539 and a test of the sub-$500 consolidation 1 area identified on the chart. This is a pretty decent buy zone. A long period of price consolidations in the middle of a strong upward move.
MACD and DMI crossed into bearish territory. RSI and CCI trend lower in line with price.
To turn bullish, TSLA needs to retake the $639 9-day MA resistance. This will then see a test of $667.
For now though, it is a classic triangle breakout.
| Support | 591 | 583 200 day | 539 | 500 | 480 | |
| Resistance | 639 9day MA | 667 bullish | 715 | 781 | 900 |
At the time of writing, the author has no position in any stock mentioned in this article and no business relationship with any company mentioned. The author has not received compensation for writing this article, other than from FXStreet.
This article is for information purposes only. The author and FXStreet are not registered investment advisors and nothing in this article is intended to be investment advice. It is important to perform your own research before making any investment and take independent advice from a registered investment advisor.
FXStreet and the author do not provide personalized recommendations. The author makes no representations as to accuracy, completeness, or the suitability of this information. FXStreet and the author will not be liable for any errors, omissions or any losses, injuries or damages arising from this information and its display or use. The author will not be held responsible for information that is found at the end of links posted on this page.
Errors and omissions excepted.
Premium
You have reached your limit of 3 free articles for this month.
Start your subscription and get access to all our original articles.
Author

Ivan Brian
FXStreet
Ivan Brian started his career with AIB Bank in corporate finance and then worked for seven years at Baxter. He started as a macro analyst before becoming Head of Research and then CFO.


