Exxon Mobil Corp.(XOM) Elliott Wave technical analysis [Video]
![Exxon Mobil Corp.(XOM) Elliott Wave technical analysis [Video]](https://editorial.fxstreet.com/images/TechnicalAnalysis/ChartPatterns/Candlesticks/foreign-exchange-market-chart-24348895.jpg)
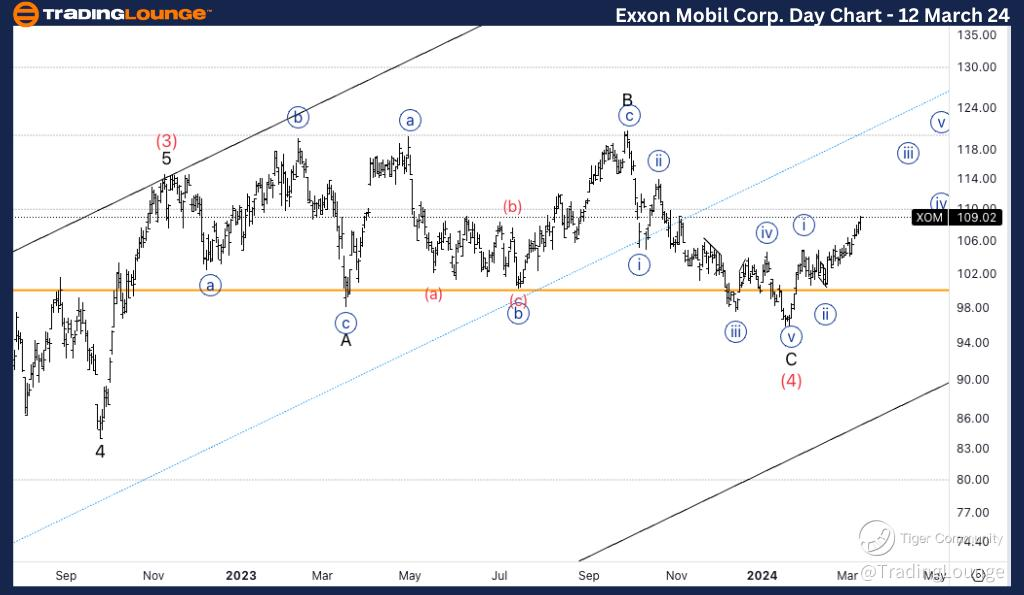
XOM Elliott Wave technical analysis
Function: Trend
Mode: Impulsive
Structure: Motive
Position: Minor 1 of (5).
Direction: Five waves up into wave 1.
Details: We have seen a long lasting correction in what could be wave (4), and we have now found support on 100$.
XOM Elliott Wave technical analysis – Daily chart
In our analysis, we identify a trending function characterized by an impulsive mode and a motive structure. Positioned in Minor wave 1 of (5), our focus lies on the completion of five waves up into wave 1. Notably, we have observed a prolonged correction, potentially indicating wave (4), with support found at $100.
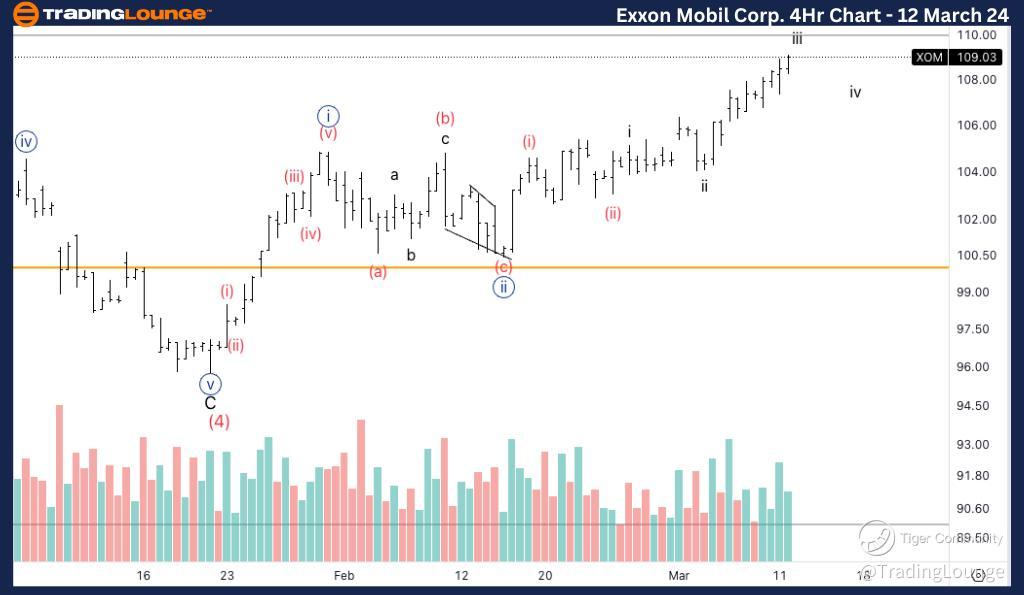
XOM Elliott Wave technical analysis
Function: Trend
Mode: Impulsive
Structure: Motive
Position: Wave (iii) of {iii}.
Direction: Completion in wave iii of (iii).
Details: We are looking at acceleration higher, as we the move up starts to become parabolic. We are also seeing increasing volume on the most recent move higher suggesting more buyers are stepping into the market.
XOM Elliott Wave technical analysis – Four-hour chart
Here, we also observe a trending function marked by an impulsive mode and a motive structure. Positioned in Wave (iii) of {iii}, our attention is on the completion of wave iii of (iii). Noteworthy is the acceleration in the upward movement, with the trajectory beginning to exhibit a parabolic shape. Moreover, the recent surge in volume suggests an increasing number of buyers entering the market, further bolstering the bullish sentiment.
XOM Elliott Wave technical analysis [Video]
Author

Peter Mathers
TradingLounge
Peter Mathers started actively trading in 1982. He began his career at Hoei and Shoin, a Japanese futures trading company.


