EURJPY Price Analysis: Bulls approach 147.00 hurdle with eyes on yearly high


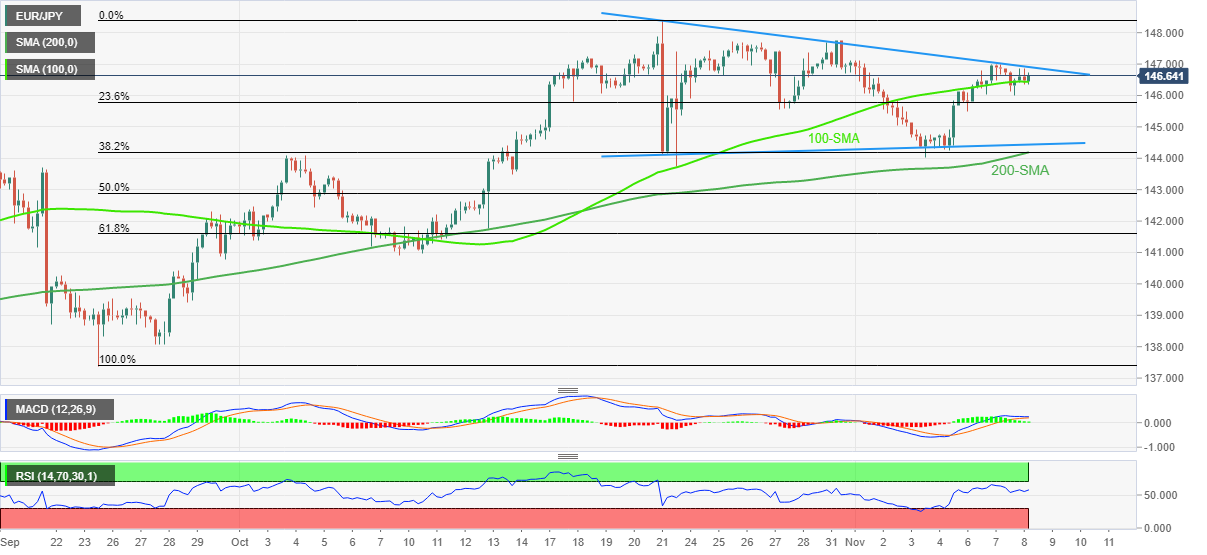
  • EURJPY rebounds from 100-SMA inside a 13-day-old symmetrical triangle.
  • MACD teases bears but firmer RSI, sustained trading beyond 200-SMA favor buyers.
  • 2014’s yearly peak could lure the bulls past October’s high.
  • 200-SMA, 144.00 could challenge short-term bears ahead of giving them control.

EURJPY picks up bids to reverse the previous day’s pullback from sub-147.00 resistance during Wednesday’s Asian session. In doing so, the cross-currency pair bounces off the 100-SMA while poking the resistance line of a two-week-old symmetrical triangle, around 146.70 by the press time.

Although the MACD signals are less bullish, the firmer RSI (14) and the quote’s sustained trading beyond the 200-SMA keep the EURJPY bulls hopeful to overcome the 147.00 resistance level.

The same could allow the pair buyers to refresh the yearly high, currently around 148.40.

In that case, the year 2014 high near 149.80 and the 150.00 round figure will gain major attention.

Alternatively, pullback moves need a downside break of the 100-SMA level surrounding 146.45 to tease the pair sellers.

Even so, support line of the aforementioned triangle, near 144.50, could challenge the EURJPY downside.

It’s worth noting that the 200-SMA and early October’s high, respectively near 144.20 and 144.00, could act as additional downside filters for the pair traders to watch before welcoming the bears.

Overall, EURJPY remains on the bull’s radar and aims to refresh the yearly high.

EURJPY: Four-hour chart

Trend: Further upside expected

Additional important levels

Overview
Today last price 146.64
Today Daily Change -0.03
Today Daily Change % -0.02%
Today daily open 146.67
 
Trends
Daily SMA20 146.08
Daily SMA50 143.52
Daily SMA100 141.09
Daily SMA200 137.91
 
Levels
Previous Daily High 147
Previous Daily Low 145.99
Previous Weekly High 147.76
Previous Weekly Low 144.04
Previous Monthly High 148.4
Previous Monthly Low 140.9
Daily Fibonacci 38.2% 146.37
Daily Fibonacci 61.8% 146.61
Daily Pivot Point S1 146.11
Daily Pivot Point S2 145.55
Daily Pivot Point S3 145.11
Daily Pivot Point R1 147.11
Daily Pivot Point R2 147.56
Daily Pivot Point R3 148.12


Share: Feed news

Information on these pages contains forward-looking statements that involve risks and uncertainties. Markets and instruments profiled on this page are for informational purposes only and should not in any way come across as a recommendation to buy or sell in these assets. You should do your own thorough research before making any investment decisions. FXStreet does not in any way guarantee that this information is free from mistakes, errors, or material misstatements. It also does not guarantee that this information is of a timely nature. Investing in Open Markets involves a great deal of risk, including the loss of all or a portion of your investment, as well as emotional distress. All risks, losses and costs associated with investing, including total loss of principal, are your responsibility. The views and opinions expressed in this article are those of the authors and do not necessarily reflect the official policy or position of FXStreet nor its advertisers. The author will not be held responsible for information that is found at the end of links posted on this page.

If not otherwise explicitly mentioned in the body of the article, at the time of writing, the author has no position in any stock mentioned in this article and no business relationship with any company mentioned. The author has not received compensation for writing this article, other than from FXStreet.

FXStreet and the author do not provide personalized recommendations. The author makes no representations as to the accuracy, completeness, or suitability of this information. FXStreet and the author will not be liable for any errors, omissions or any losses, injuries or damages arising from this information and its display or use. Errors and omissions excepted.

The author and FXStreet are not registered investment advisors and nothing in this article is intended to be investment advice.

Recommended content


Recommended content

Editors’ Picks

EUR/USD holds gains above 1.0700, as key US data loom

EUR/USD holds gains above 1.0700, as key US data loom

EUR/USD holds gains above 1.0700 in the European session on Thursday. Renewed US Dollar weakness offsets the risk-off market environment, supporting the pair ahead of the key US GDP and PCE inflation data. 

EUR/USD News

GBP/USD extends recovery above 1.2500, awaits US GDP data

GBP/USD extends recovery above 1.2500, awaits US GDP data

GBP/USD is catching a fresh bid wave, rising above 1.2500 in European trading on Thursday. The US Dollar resumes its corrective downside, as traders resort to repositioning ahead of the high-impact US advance GDP data for the first quarter. 

GBP/USD News

Gold price edges higher amid weaker USD and softer risk tone, focus remains on US GDP

Gold price edges higher amid weaker USD and softer risk tone, focus remains on US GDP

Gold price (XAU/USD) attracts some dip-buying in the vicinity of the $2,300 mark on Thursday and for now, seems to have snapped a three-day losing streak, though the upside potential seems limited. 

Gold News

XRP extends its decline, crypto experts comment on Ripple stablecoin and benefits for XRP Ledger

XRP extends its decline, crypto experts comment on Ripple stablecoin and benefits for XRP Ledger

Ripple extends decline to $0.52 on Thursday, wipes out weekly gains. Crypto expert asks Ripple CTO how the stablecoin will benefit the XRP Ledger and native token XRP. 

Read more

US Q1 GDP Preview: Economic growth set to remain firm in, albeit easing from Q4

US Q1 GDP Preview: Economic growth set to remain firm in, albeit easing from Q4

The United States Gross Domestic Product (GDP) is seen expanding at an annualized rate of 2.5% in Q1. The current resilience of the US economy bolsters the case for a soft landing. 

Read more

Forex MAJORS

Cryptocurrencies

Signatures