|

EURJPY Price Analysis: A bullish-engulfing pattern to open the way toward 146.00 and beyond

  • A bullish-engulfing candle pattern in the EURJPY daily chart could open the door for further gains.
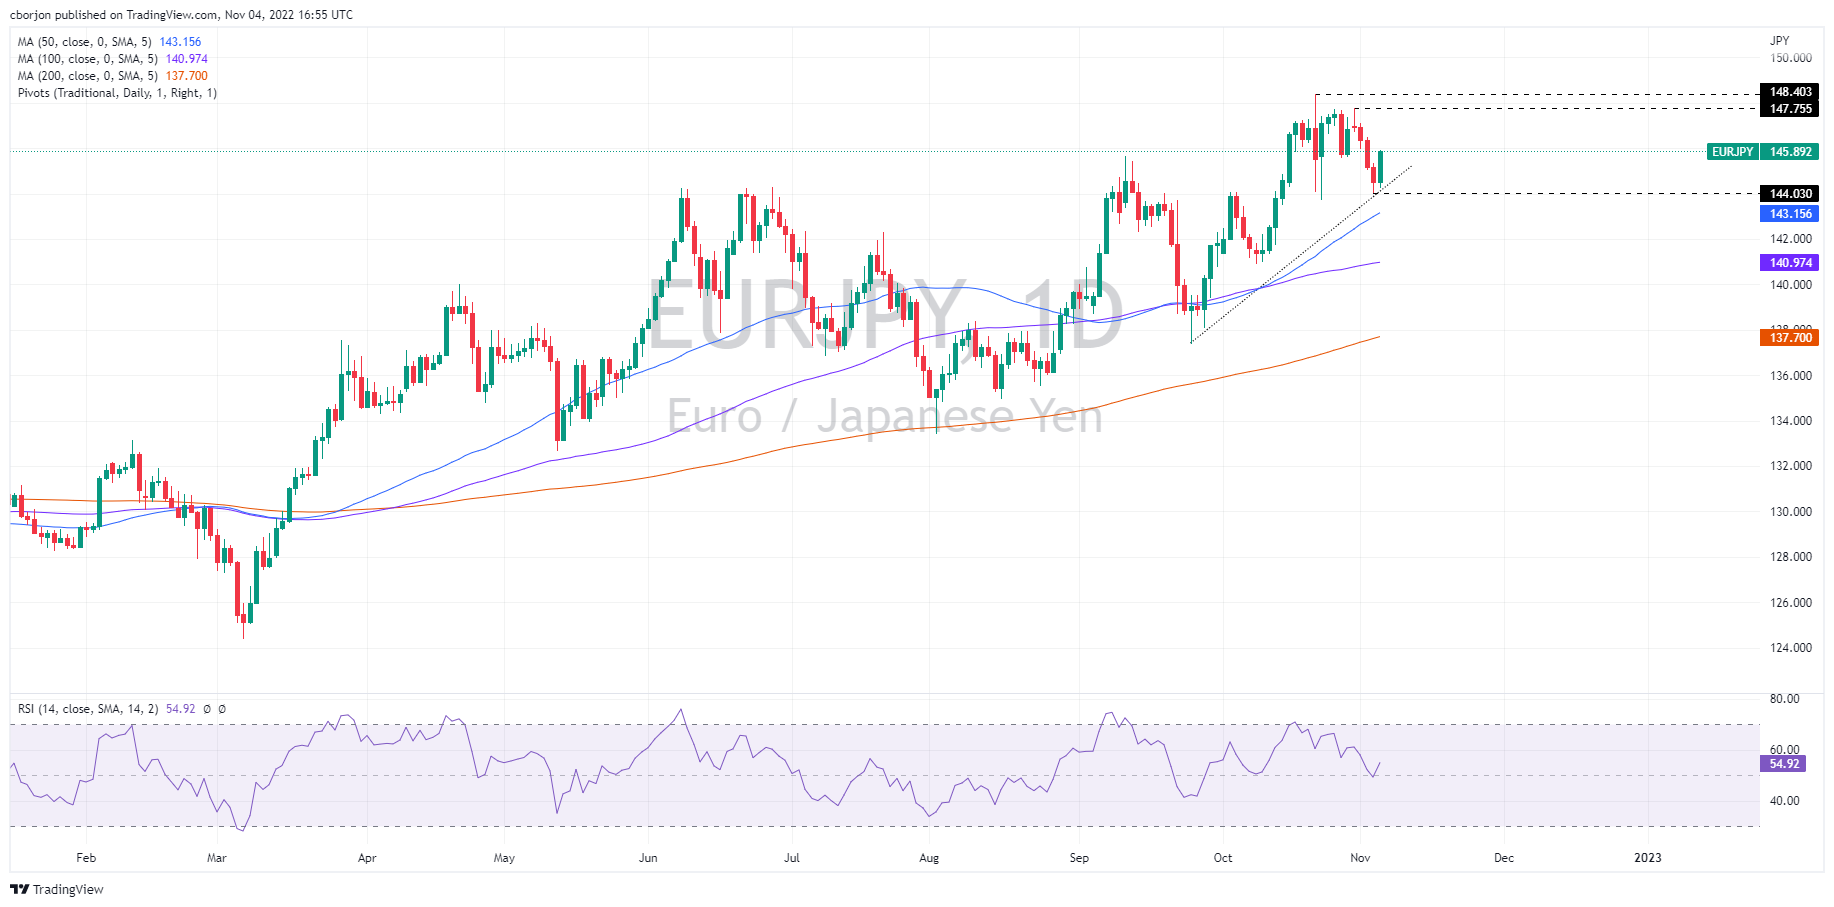
  • If the EURJPY struggles at 146.00, a fall towards 144.00 is on the cards, ahead of the 50-day EMA at 143.15.

The EURJPY rises during the North American session, forming a bullish-engulfing pattern in the daily chart, nearby the weekly lows at around 144.00, and set to finish the week with losses of 0.66%. At the time of writing, the EURJPY is trading at 145.89, above its opening price by almost 1%.

EURJPY Price Analysis: Technical outlook

As abovementioned, the EURJPY daily chart depicts a two-candle bullish formation that suggests upward pressure is mounting on the pair. The Relative Strength Index (RSI) offers further confirmation, as the oscillator dived towards the 50-midline, but as price action spiked towards the fresh two-day high shy of 146.00, the RSI slope turned bullish, in sync with the EURJPY price action.

If the EURJPY clears the 146.00 figure, it will pave the way for further gains. Firstly, the November 2 daily high at 146.48, followed by the 147.00 figure, ahead of the October 31 swing high at around 147.74.

On the other hand, failure to crack 146.00, the EURJPY could tumble towards the November 3 swing low at 144.03. A breach of the latter will expose crucial demand zones like the 50-day Exponential Moving Average (EMA) at 143.15, ahead of the psychological 143.00 figure and the 142.00 mark.

EURJPY Key Technical Levels

EUR/JPY

Overview
Today last price145.89
Today Daily Change1.50
Today Daily Change %1.04
Today daily open144.36
 
Trends
Daily SMA20145.34
Daily SMA50143.03
Daily SMA100140.97
Daily SMA200137.65
 
Levels
Previous Daily High145.5
Previous Daily Low144.04
Previous Weekly High147.72
Previous Weekly Low143.73
Previous Monthly High148.4
Previous Monthly Low140.9
Daily Fibonacci 38.2%144.59
Daily Fibonacci 61.8%144.94
Daily Pivot Point S1143.76
Daily Pivot Point S2143.17
Daily Pivot Point S3142.3
Daily Pivot Point R1145.23
Daily Pivot Point R2146.09
Daily Pivot Point R3146.69

Author

Christian Borjon Valencia

Christian Borjon began his career as a retail trader in 2010, mainly focused on technical analysis and strategies around it. He started as a swing trader, as he used to work in another industry unrelated to the financial markets.

More from Christian Borjon Valencia
Share:

Markets move fast. We move first.

Orange Juice Newsletter brings you expert driven insights - not headlines. Every day on your inbox.

By subscribing you agree to our Terms and conditions.

Editor's Picks

EUR/USD continues its rise as Dollar retreats on Fed action and soft data

EUR/USD advances during the North American on Thursday up 0.41% after the Fed decided to cut rates, alongside the release of weaker than expected job data in the United States. The pair trades at 1.1742 after bouncing off daily lows of 1.1682.

GBP/USD steadies at fresh near-term highs

GBP/USD is holding firmly in bullish territory heading into the tail end of the week, but Cable bidders ran into a technical resistance point at the 1.3400 handle on Thursday. The Federal Reserve delivered a third straight interest rate cut this week, bolstering broad-market risk appetite and pushing the US Dollar into the low side across the board.

Gold remains poised to regain $4,300 and beyond

Gold sits at seven-week highs after having settled above $4,275 key resistance on Thursday. US Dollar sees a modest rebound amid profit-taking following the two-day Fed-led slump. Gold’s daily technical setup suggests that there is scope for more upside.

Top Crypto Gainers: Zcash, MYX Finance, MemeCore extend gains as market recovers

Zcash, MYX Finance, and MemeCore lead the cryptocurrency market recovery with double-digit gains over the last 24 hours. The technical outlook for Zcash and MemeCore suggests upside potential, while the MYX Finance token remains trapped between converging moving averages. 

FOMC Summary: A split cut and a clear shift toward caution

The Federal Reserve (Fed) went ahead with a 25 basis points rate cut, taking the target range to 3.50–3.75%. But the tone around the decision mattered just as much as the move.

Solana dips as hawkish Fed cuts dampen market sentiment
Solana (SOL) price is trading below $130 at the time of writing on Thursday, after being rejected at the upper boundary of its falling wedge pattern. The broader market weakness following the Federal Reserve’s hawkish rate cut has added to downside momentum.