EUR/USD Technical Analysis: Seesaws around 61.8% Fibo. amid bullish MACD
- EUR/USD stays below 200-bar SMA.
- A downside break could recall October 08 low.
- 38.2% Fibonacci retracement adds to the resistance.

Despite staying below 200-bar Simple Moving Average (SMA), EUR/USD bounces off 61.8% Fibonacci retracement of its October month upside while taking rounds to 1.1006 during early Thursday.
Favoring the price pullback is a bullish signal from 12-bar Moving Average Convergence and Divergence (MACD).
However, bulls are likely to wait for an upside break of 200-bar SMA, at 1.1058 now, followed by 38.2% Fibonacci retracement and late-October lows surrounding 1.1065/75, to target 1.1100 mark.
In a case where prices keep trading southwards and break 1.0994 level of 61.8% Fibonacci retracement, October 08 low near 1.0940 and the previous month bottom around 1.0880 will be the bears’ favorites.
EUR/USD 4-hour chart
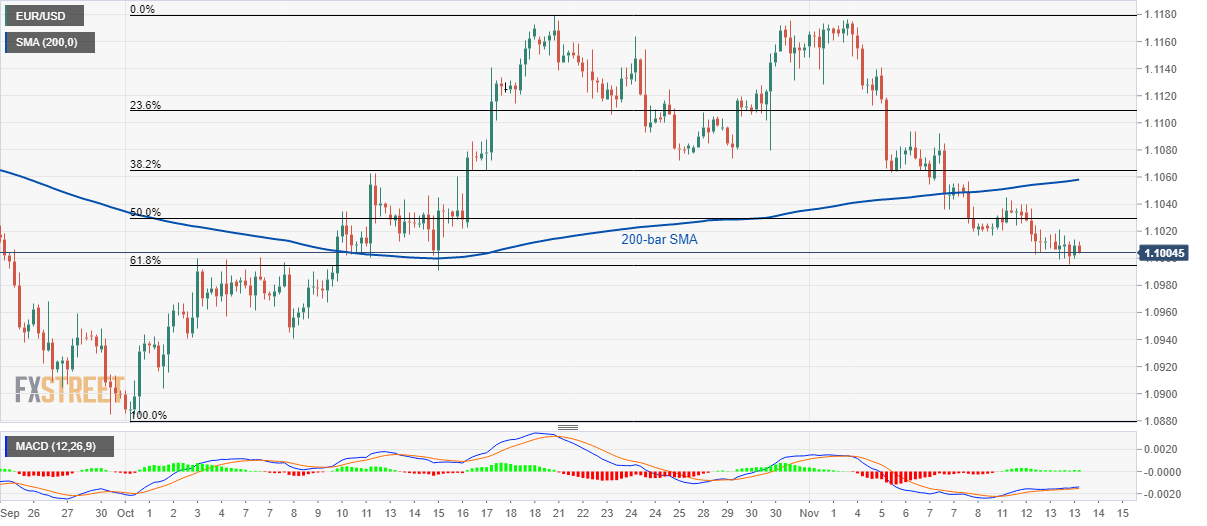
Trend: Bearish
Author

Anil Panchal
FXStreet
Anil Panchal has nearly 15 years of experience in tracking financial markets. With a keen interest in macroeconomics, Anil aptly tracks global news/updates and stays well-informed about the global financial moves and their implications.


