|

EUR/USD Technical Analysis: recovery could extend to the 100-day SMA at 1.1128

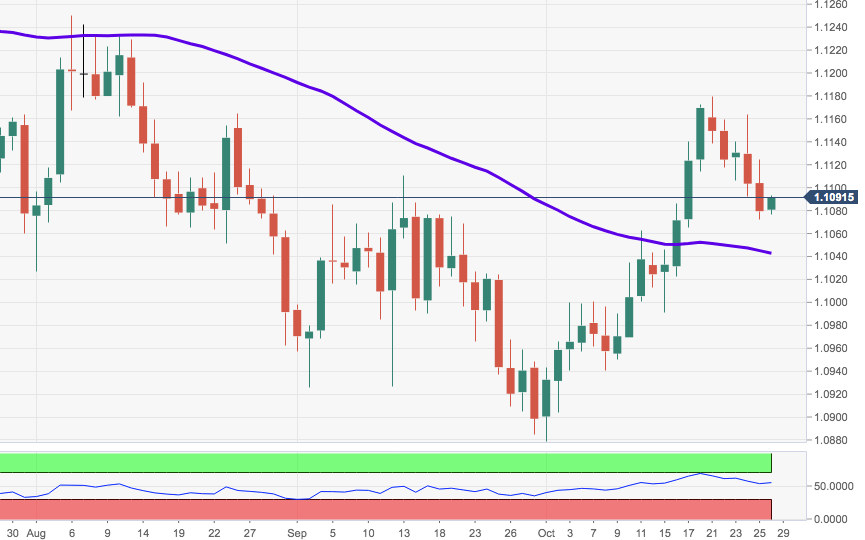
  • EUR/USD is rebounding from recent lows in the 1.1070 region after two consecutive daily pullbacks.
  • Despite the ongoing recovery, Thursday’s bearish ‘outside day’ remains well in place and still points to further losses in the near term.
  • That said, a deeper pullback should see the 55-day SMA at 1.1042 retested. This area of support is reinforced by the proximity of the 21-day SMA, today at 1.1036.
  • On the upside, the 100-day SMA at 1.1128 emerges as the initial target.

EUR/USD daily chart
EUR/USD

Overview
Today last price1.1094
Today Daily Change21
Today Daily Change %0.13
Today daily open1.108
 
Trends
Daily SMA201.1036
Daily SMA501.1036
Daily SMA1001.1132
Daily SMA2001.1204
 
Levels
Previous Daily High1.1124
Previous Daily Low1.1072
Previous Weekly High1.1063
Previous Weekly Low1.0941
Previous Monthly High1.111
Previous Monthly Low1.0885
Daily Fibonacci 38.2%1.1092
Daily Fibonacci 61.8%1.1105
Daily Pivot Point S11.106
Daily Pivot Point S21.104
Daily Pivot Point S31.1008
Daily Pivot Point R11.1112
Daily Pivot Point R21.1144
Daily Pivot Point R31.1164

Author

Pablo Piovano

Born and bred in Argentina, Pablo has been carrying on with his passion for FX markets and trading since his first college years.

More from Pablo Piovano

Share:

Editor's Picks

GBP/USD gathers strength to near 1.3550 as Fed hike bets fade, UK jobs data loom

The GBP/USD pair gains momentum to around 1.3550 during the early Asian trading hours. The US Dollar softens against the British Pound as cooler US inflation data have prompted traders to reduce bets on a US Federal Reserve rate hike. The UK employment report will be in the spotlight later on Tuesday.

EUR/USD flat lines below two-month high amid oil-driven inflation fears

The EUR/USD pair holds steady around the 1.1575-1.1580 region during the Asian session, and for now seems to have stalled the previous day's modest pullback from a two-month top. However, a modest US Dollar uptick warrants some caution before positioning for the resumption of the recent move higher from the 1.1350 area, or the July monthly swing low.

Gold drifts lower amid oil-driven inflation risks and US-Iran tensions

Gold attracts some sellers following a modest Asian session uptick, stalling a two-day move higher from the $4,300 neighborhood. The US Dollar builds on the overnight bounce from a two-month trough as inflation risks stemming from higher crude oil prices underpin prospects for at least one interest rate hike by the US Federal Reserve in 2026. Adding to this, the US-Iran standoff keeps the geopolitical risk premium in play and further underpins the safe-haven Greenback, which is seen exerting pressure on the precious metal.

Ripple and Stellar remain under bearish pressure as corrective declines cap upside

Ripple and Stellar remain under pressure as broader market uncertainty and weak technical momentum weigh on both altcoins. XRP is hovering below the key $1 mark on Tuesday while XLM continues its corrective decline below $0.157. Meanwhile, mixed derivatives and on-chain signals indicate cautious sentiment, leaving both cryptocurrencies vulnerable to further downside.

Silver’s new era: Supply deficits meet exploding industrial demand
Silver has experienced a wild ride in 2026, but The Silver Institute President and CEO Michael DiRienzo says investors shouldn’t let the volatility obscure a much bigger story: the underlying silver market remains remarkably strong.
Why is Crude Oil priced for a reopening the ships haven't made?
Fourteen vessels crossed the Strait of Hormuz on Tuesday. Before the war, the count ran near 120 a day. In the sessions since the waterway was publicly declared open, Brent has drifted back to $87 and West Texas Intermediate (WTI) to $81, both a little lower again on Wednesday, with daily momentum on each unwound from the top of its range in late July to the low twenties now.