|

EUR/USD technical analysis: Fiber stuck near 1.1100 handle in the first part of the New York session

  • EUR/USD is trading quietly near 1.1100 at the start of the New York session.
  • Market uncertainty can see the Fiber stuck in a range between 1.1098 and 1.1134 in the near term.
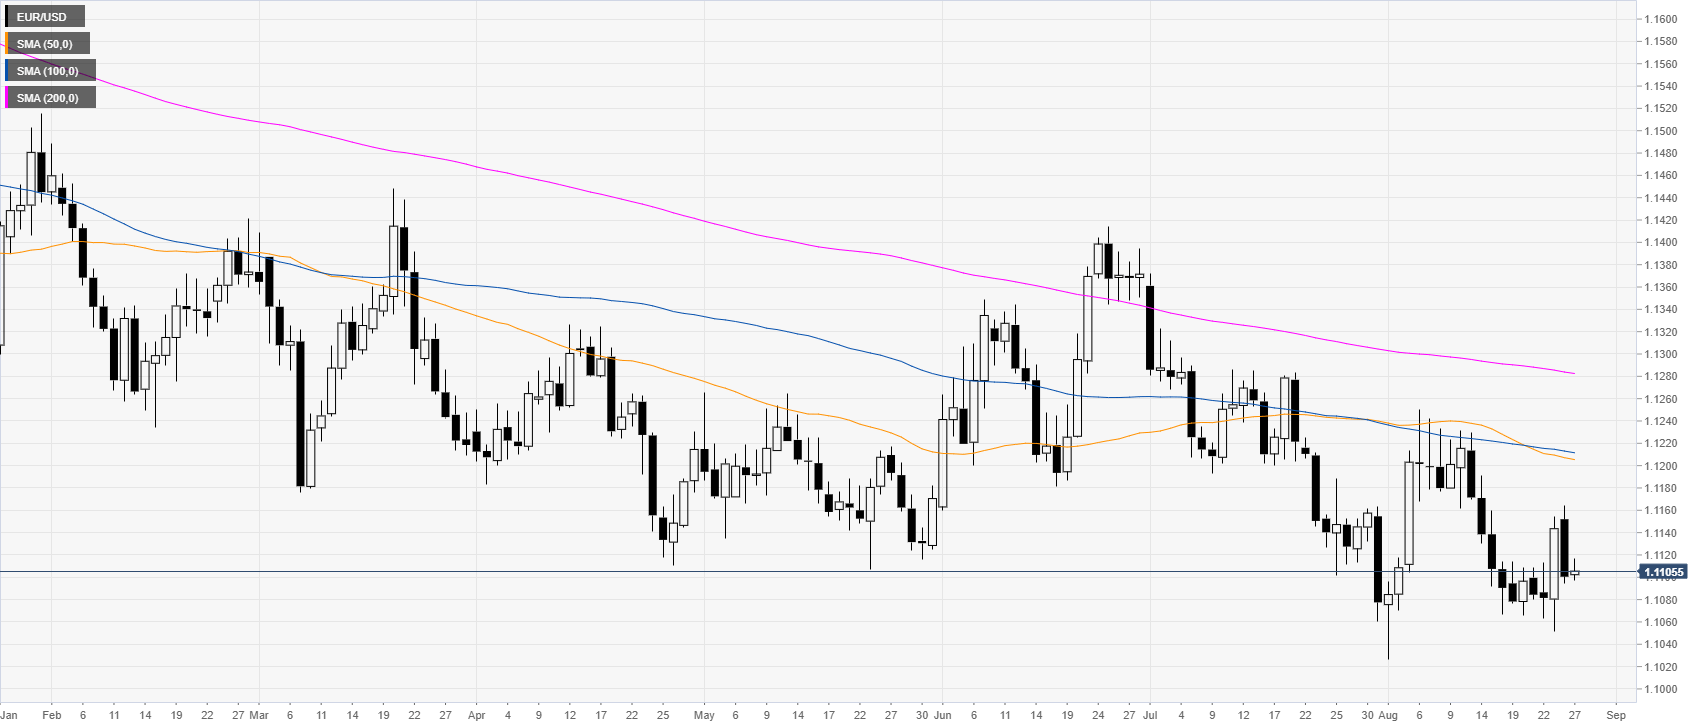
 

EUR/USD daily chart

 
On the daily time-frame, the single currency is trading in a bear trend below the main daily simple moving averages (DSMAs).

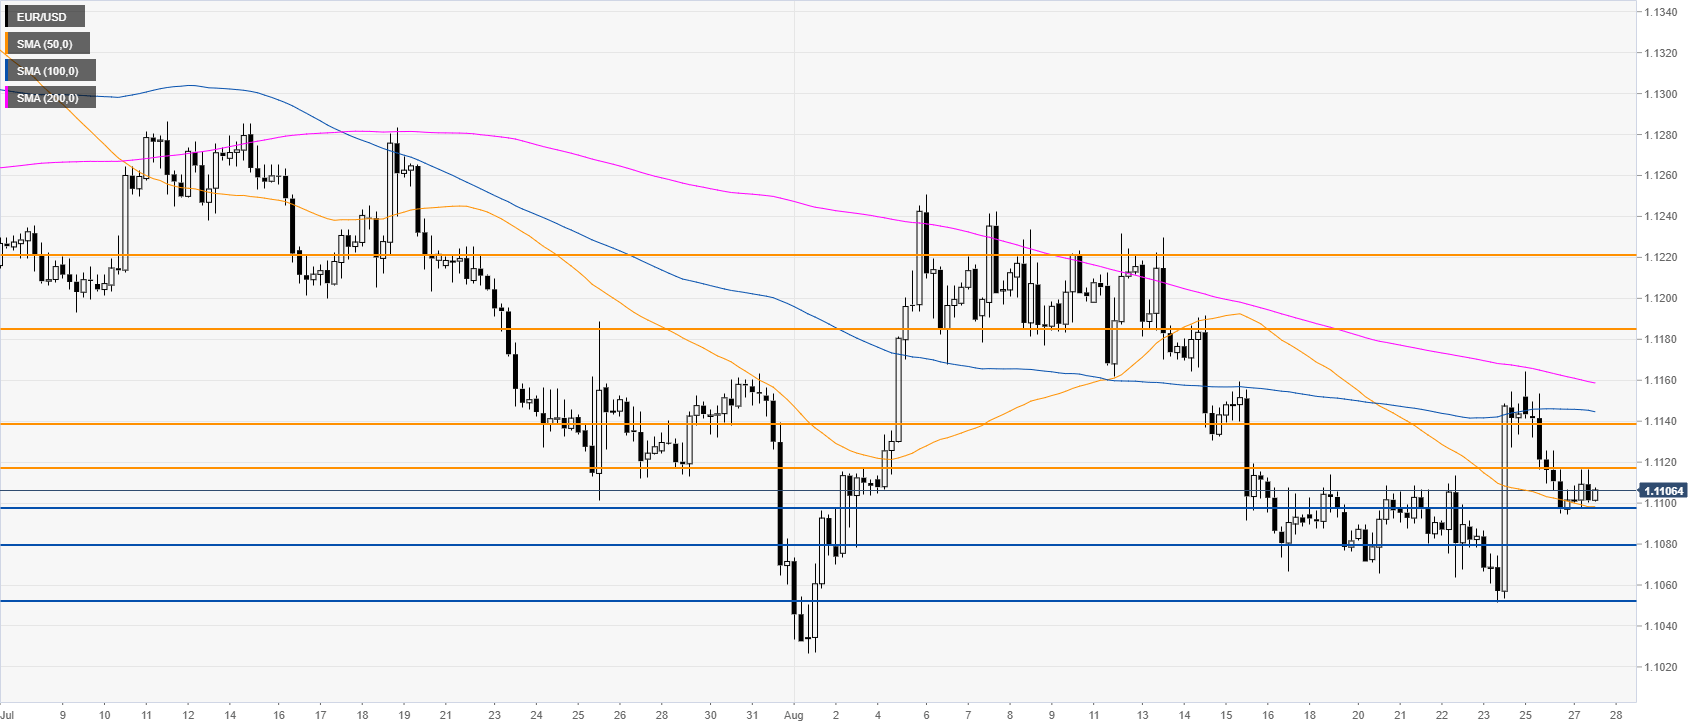
EUR/USD 4-hour chart

 
The Fiber is stuck between the 1.1098 support and 1.1117 resistance while above the 50 SMA. If the sellers have a sustained breakout below 1.1098 the market may drop towards the 1.1080 and 1.1052 levels, according to the Technical Confluences Indicator.


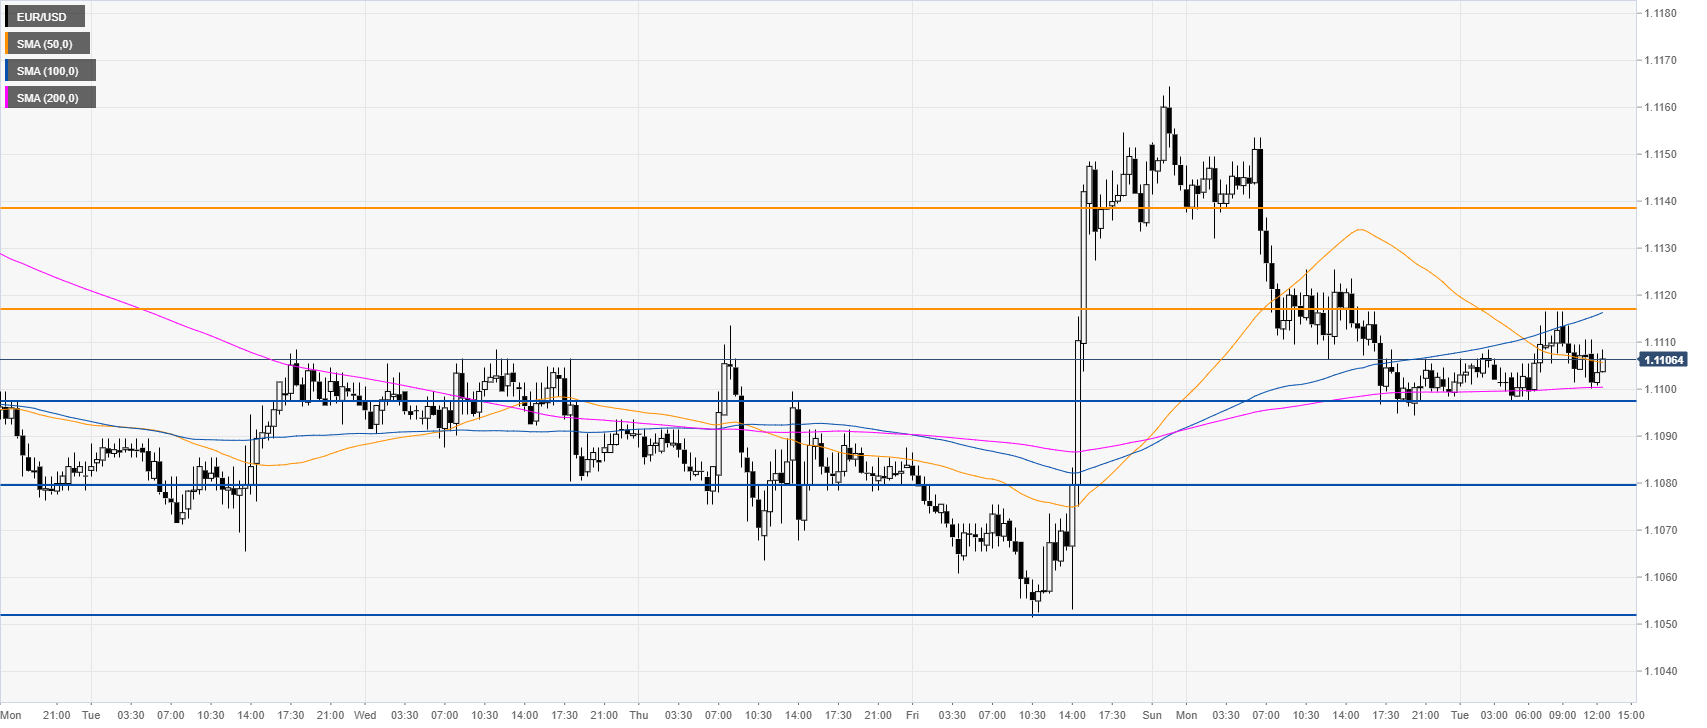
EUR/USD 30-minute chart

 
EUR/USD is trading in the middle of its daily range currently supported by the 1.1098 support and the 200 SMA. However, bulls have much work to do as they need to break 1.1117 strong resistance followed by the 1.1134 level, according to the Technical Confluences Indicator.


Additional key levels

EUR/USD

Overview
Today last price1.1104
Today Daily Change0.0004
Today Daily Change %0.04
Today daily open1.11
 
Trends
Daily SMA201.1136
Daily SMA501.1207
Daily SMA1001.1213
Daily SMA2001.1284
Levels
Previous Daily High1.1164
Previous Daily Low1.1094
Previous Weekly High1.1154
Previous Weekly Low1.1052
Previous Monthly High1.1373
Previous Monthly Low1.106
Daily Fibonacci 38.2%1.1121
Daily Fibonacci 61.8%1.1138
Daily Pivot Point S11.1075
Daily Pivot Point S21.105
Daily Pivot Point S31.1005
Daily Pivot Point R11.1145
Daily Pivot Point R21.119
Daily Pivot Point R31.1215

Author

Flavio Tosti

Flavio Tosti

Independent Analyst


More from Flavio Tosti
Share:

Markets move fast. We move first.

Orange Juice Newsletter brings you expert driven insights - not headlines. Every day on your inbox.

By subscribing you agree to our Terms and conditions.

Editor's Picks

EUR/USD clings to small gains near 1.1750

Following a short-lasting correction in the early European session, EUR/USD regains its traction and clings to moderate gains at around 1.1750 on Monday. Nevertheless, the pair's volatility remains low, with investors awaiting this weeks key data releases from the US and the ECB policy announcements.

GBP/USD edges higher toward 1.3400 ahead of US data and BoE

GBP/USD reverses its direction and advances toward 1.3400 following a drop to the 1.3350 area earlier in the day. The US Dollar struggles to gather recovery momentum as markets await Tuesday's Nonfarm Payrolls data, while the Pound Sterling holds steady ahead of the BoE policy announcements later in the week.

Gold stuck around $4,300 as markets turn cautious

Gold loses its bullish momentum and retreats below $4,350 after testing this level earlier on Monday. XAU/USD, however, stays in positive territory as the US Dollar remains on the back foot on growing expectations for a dovish Fed policy outlook next year.

Solana consolidates as spot ETF inflows near $1 billion signal institutional dip-buying

Solana price hovers above $131 at the time of writing on Monday, nearing the upper boundary of a falling wedge pattern, awaiting a decisive breakout. On the institutional side, demand for spot Solana Exchange-Traded Funds remained firm, pushing total assets under management to nearly $1 billion since launch. 

Big week ends with big doubts

The S&P 500 continued to push higher yesterday as the US 2-year yield wavered around the 3.50% mark following a Federal Reserve (Fed) rate cut earlier this week that was ultimately perceived as not that hawkish after all. The cut is especially boosting the non-tech pockets of the market.

Solana Price Forecast: SOL consolidates as spot ETF inflows near $1 billion signal institutional dip-buying

Solana (SOL) price hovers above $131 at the time of writing on Monday, nearing the upper boundary of a falling wedge pattern, awaiting a decisive breakout.