|

EUR/USD technical analysis: Fiber enters the Asian session near Tuesday’s lows

  • The Greenback picked up some steam this Tuesday, helping EUR/USD to decline near two-day lows.
  • The Brexit chaos is weighing on the market mood and the Euro. 
  • The key macroeconomic event of the week is the European Central Bank (ECB) interest rate decision on Thursday.
 

EUR/USD daily chart


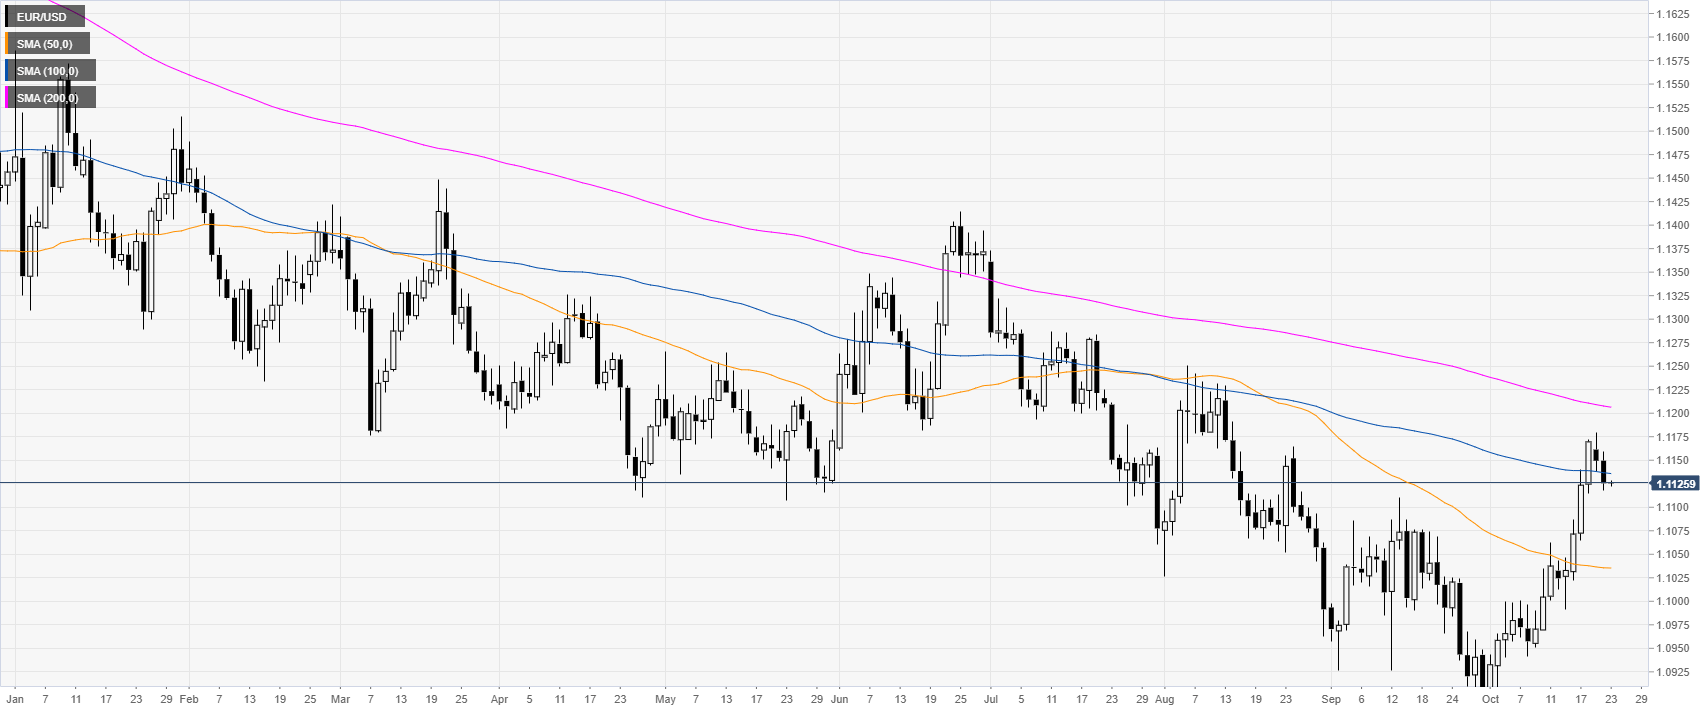
On the daily chart, the shared currency is trading in a bear trend below the 100 and 200-day simple moving averages (DSMAs). The Brexit optimism is fading somewhat and it is weighing on the Euro. Investors will start to focus on the key macroeconomic event of the week: the European Central Bank (ECB) interest rate decision on Thursday.


EUR/USD four-hour chart

 
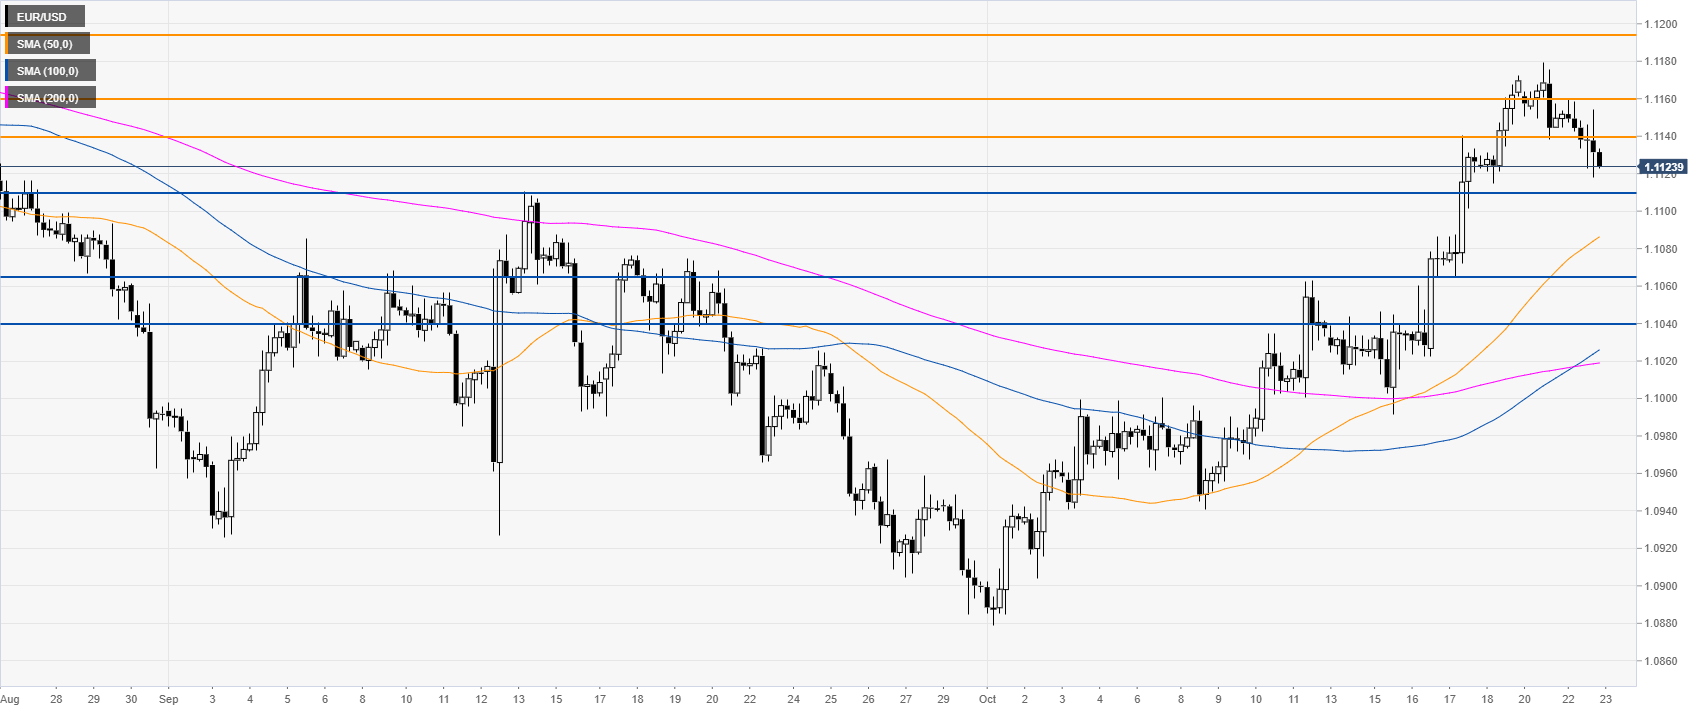
EUR/USD, on the four-hour chart, is retracing down from the October highs, trading now below the 1.1140 level. As the market is weakening, the retracement can extend towards the 1.1110 and 1.1065 price levels on the way down, according to the Technical Confluences Indicator.
 

EUR/USD 30-minute chart


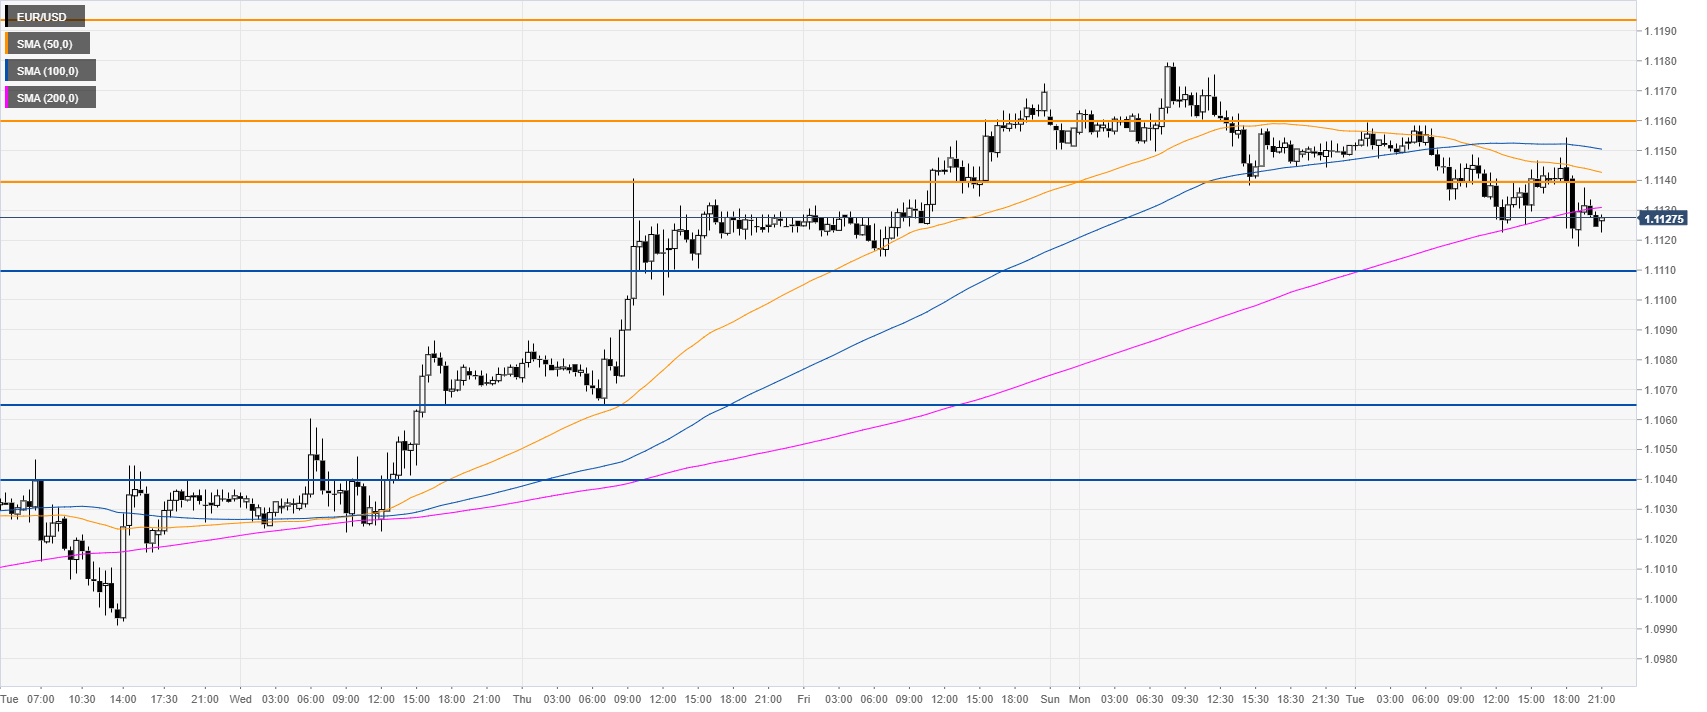
The Fiber is trading below its main SMAs on the 30-minute chart, suggesting a bearish bias in the near term. Resistance can be seen near 1.1140 and 1.1160 price levels, according to the Technical Confluences Indicator.
 

Additional key levels

EUR/USD

Overview
Today last price1.1126
Today Daily Change-0.0024
Today Daily Change %-0.22
Today daily open1.115
 
Trends
Daily SMA201.1006
Daily SMA501.1037
Daily SMA1001.1138
Daily SMA2001.1209
 
Levels
Previous Daily High1.118
Previous Daily Low1.1138
Previous Weekly High1.1063
Previous Weekly Low1.0941
Previous Monthly High1.111
Previous Monthly Low1.0885
Daily Fibonacci 38.2%1.1154
Daily Fibonacci 61.8%1.1164
Daily Pivot Point S11.1132
Daily Pivot Point S21.1115
Daily Pivot Point S31.1091
Daily Pivot Point R11.1173
Daily Pivot Point R21.1197
Daily Pivot Point R31.1215

Author

Flavio Tosti

Flavio Tosti

Independent Analyst


More from Flavio Tosti

Share:

Editor's Picks

GBP/USD holds range below mid-1.3600s amid Fed risks and Iran tensions

The GBP/USD pair extends its sideways consolidative price move for the second straight day, and trades around the 1.3630 area during the Asian session. The US Dollar is looking to build on its modest recovery from the lowest level since May 14, and is acting as a headwind for the currency pair. The lack of follow-through selling warrants some caution for bearish traders.

EUR/USD gains support amid hawkish ECB expectations, subdued US Dollar

EUR/USD inches higher after posting minor losses in the previous day, trading around 1.1670 during the Asian hours. The pair finds support as rising oil prices, elevated bond yields, and escalating Middle East tensions drive Eurozone inflation concerns. These factors have boosted expectations for a more hawkish stance from the European Central Bank, which is widely anticipated to deliver a 25-basis-point rate hike in September.

$4700 tested as Gold pulls back but bullish potential remains intact
Gold has pulled back sharply from fresh 15-week highs of $4,697, snapping a two-day uptrend in Asia on Tuesday. The US Dollar (USD) holds onto recovery gains, capping further upside in the bullion.
Bitcoin tops $80,000 as US Treasury fights high yields – AERO, VIRTUAL rally

Bitcoin extends gains above $80,000 as broader market risk-on sentiment persists. The scarce asset could extend its rally as the US Treasury combats high yields in the long-dated bond market, with further interventions on the horizon. Aerodrome Finance (AERO) and Virtuals Protocol (VIRTUAL) emerged as top performers over the last 24 hours.

The forex market is switching to a ‘debasement trade’
The US dollar has stabilised near three-month lows thanks to a rapid recovery in Treasury bond yields. Yields on 30-year bonds are returning to the levels seen following the Treasury’s announcement that it was increasing the minimum purchase volume to $4 billion. The greenback got support from falling stock indices, the continued rally in Brent crude, and positive signals from the US economy.
$20 billion offered, $2 billion taken: Why Treasury doubled its buyback cap

The US Treasury moved off its own calendar on Wednesday, and that is the part worth sitting with. At 12:32 GMT, the department said it would at least double the size of liquidity support buyback operations in the 10-year to 20-year and 20-year to 30-year sectors, lifting the maximum from $2 billion per operation to at least $4 billion, effective September 9 and running to November 4.