|

EUR/USD technical analysis: Euro rolling into the Asian session flirting with the September highs

  • EUR/USD spikes to September highs as the ECB is cutting rates and announcing QE in November.
  • Friday will be key as the market will decide if Thursday’s spike is an over-reaction or the start of a recovery. 
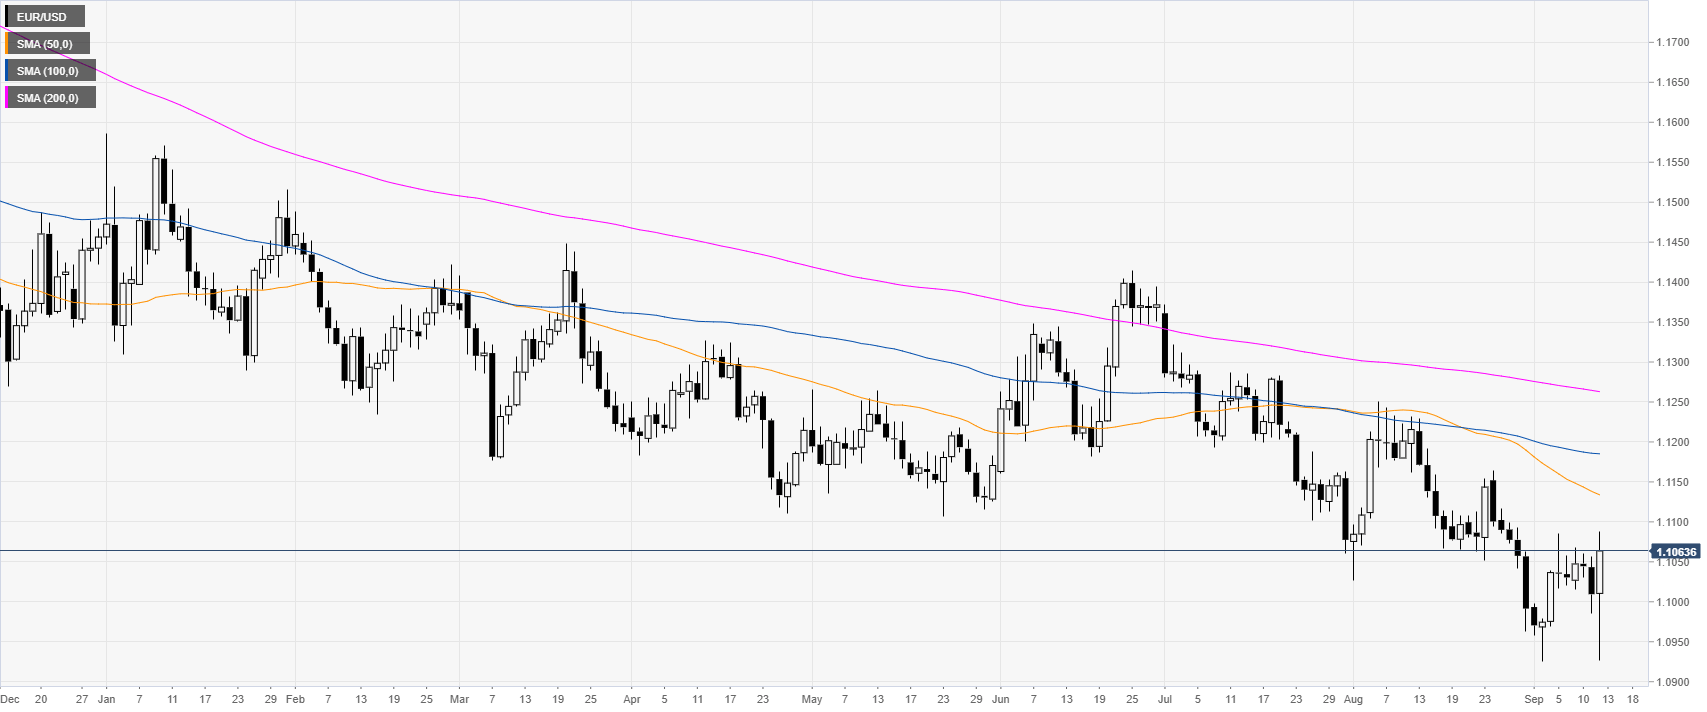
 

EUR/USD daily chart

 
On the daily time-frame, the common currency is trading in a bear trend below the main daily simple moving averages (DSMAs). Earlier on Thursday, the European Central Bank’s (ECB) has cut interest rates by 0.1% and announced an open-ended Quantitive Easing (QE).
 

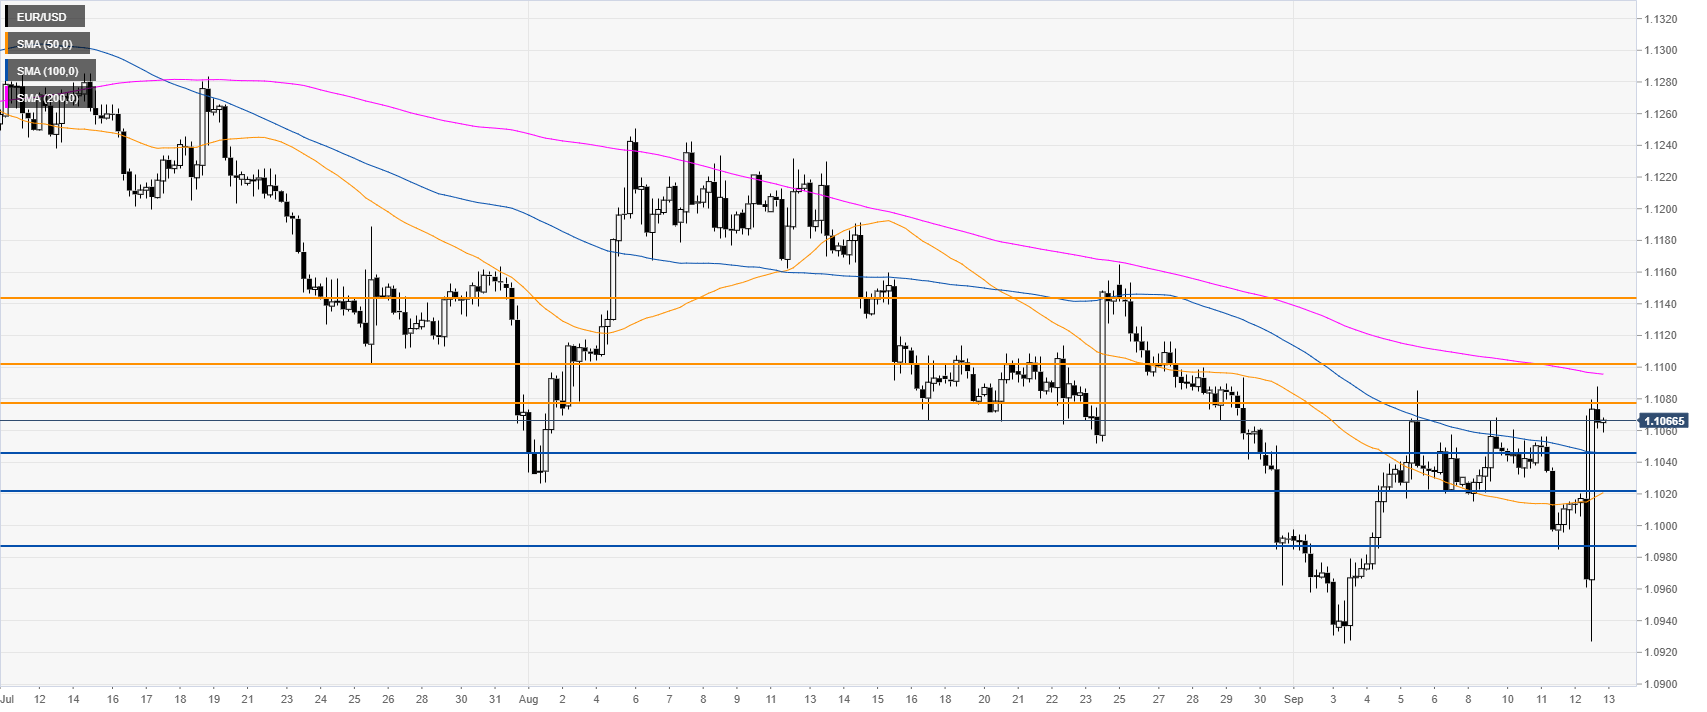
EUR/USD four-hour chart

 
The Fiber had a massive spike up to the 1.1075 resistance regaining the 50 and 100 SMAs. This Friday, it will be interesting to see if the bulls can push EUR/USD above the current September high near the 1.1075 resistance. The next resistances on the way up are seen at the 1.1103 and 1.1143 level, according to the Technical Confluences Indicator


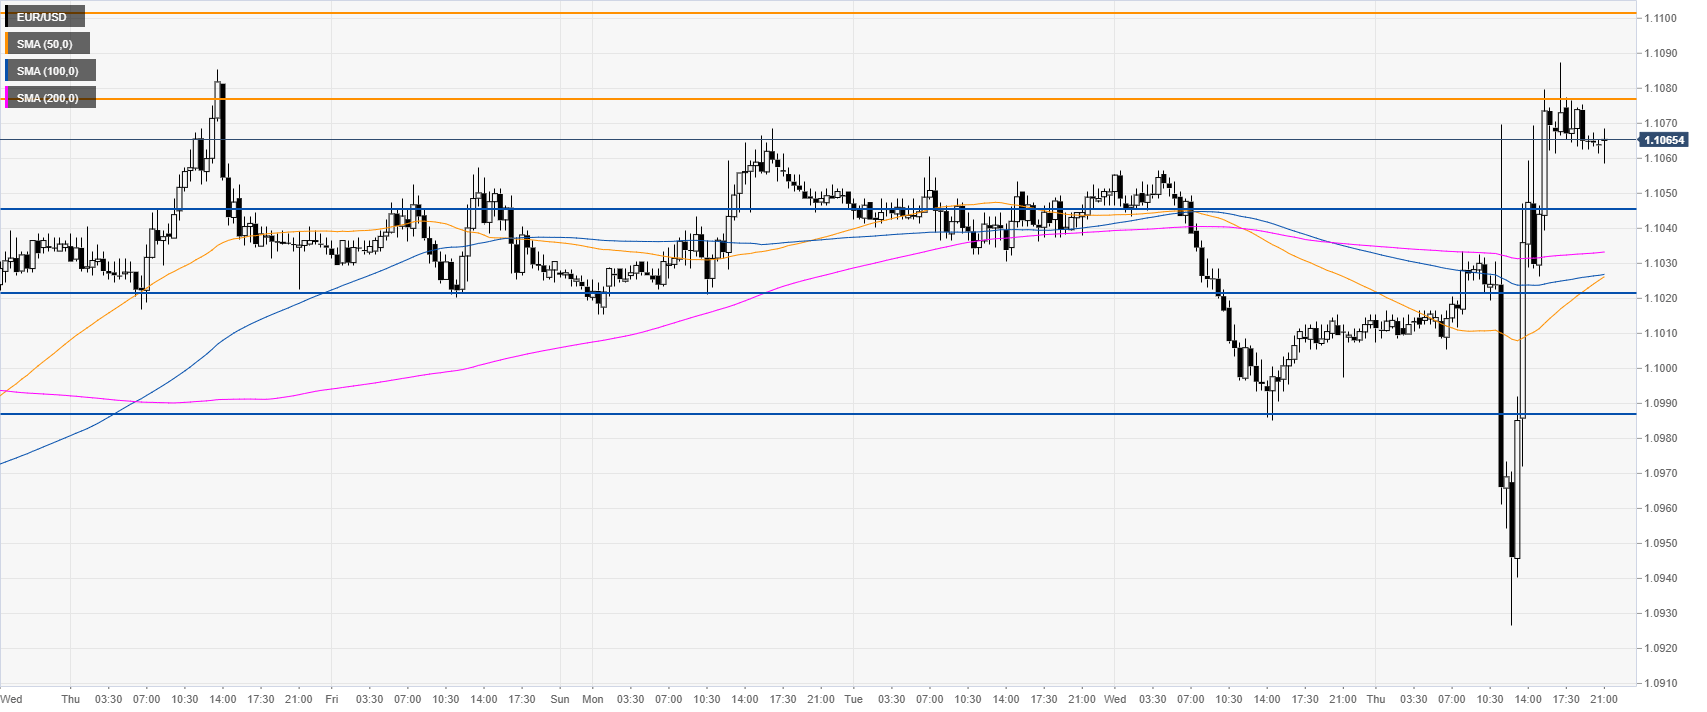
EUR/USD 30-minute chart

 
The 1.1075 is a significant resistance. If the market fails to build on the recent spike, the market can start to pullback down towards 1.1048, 1.1023 and 1.0988 support levels.

Additional key levels

EUR/USD

Overview
Today last price1.1066
Today Daily Change0.0052
Today Daily Change %0.47
Today daily open1.1014
 
Trends
Daily SMA201.1058
Daily SMA501.1138
Daily SMA1001.1186
Daily SMA2001.1265
Levels
Previous Daily High1.1056
Previous Daily Low1.0985
Previous Weekly High1.1085
Previous Weekly Low1.0926
Previous Monthly High1.1251
Previous Monthly Low1.0962
Daily Fibonacci 38.2%1.1012
Daily Fibonacci 61.8%1.1029
Daily Pivot Point S11.0981
Daily Pivot Point S21.0948
Daily Pivot Point S31.091
Daily Pivot Point R11.1051
Daily Pivot Point R21.1089
Daily Pivot Point R31.1122

Author

Flavio Tosti

Flavio Tosti

Independent Analyst


More from Flavio Tosti
Share:

Editor's Picks

EUR/USD shifts its attention to 1.1900 and above

EUR/USD has shaken off Tuesday’s dip, pushing back beyond the 1.1800 mark amid decent gains as  Wednesday’s session draws to a close. The rebound is largely driven by a modest pullback in the US Dollar, as markets digest the aftermath of President Trump’s SOTU speech and continue to monitor trade-related headlines and signals from the White House.
 

GBP/USD challenges multi-day highs near 1.3530

GBP/USD leaves behind the previous day’s decline and regains fresh upside traction on Wednesday, surpassing the 1.3500 barrier in a context of a modest decline in the Greenback and a generalised improved mood in the risk-linked space. Meanwhile, the US tariff narrative continues to dictate the mood among market participants after Presidet Trump’s SOTU speech failed to surprise markets.

Gold remains bid and close to $5,200

Gold buyers are returning to the fold on Wednesday, targeting the $5,200 area and possibly beyond, after Tuesday’s corrective dip from monthly highs. The rebound in the precious metal comes as the US Dollar loses traction, with Trump’s SOTU speech offering little fresh direction and AI-related nerves continuing to ease.

UK financial watchdog advances stablecoin oversight as four firms pilot issuance

The Financial Conduct Authority (FCA) in the United Kingdom (UK) is advancing toward the final stablecoin regulatory framework with a pilot program involving four companies, including Monee, Financial Technologies ReStabilise, Revolut and VVTX.

Nvidia earnings to influence AI trade and broader market sentiment

For the last three years, Nvidia has been the engine of the AI boom, and now Wall Street is watching to see whether that momentum can keep going. High-growth stocks have been struggling to maintain their bullish trend in 2026.

Cosmos Hub Price Forecast: ATOM rebounds slightly, bearish outlook remains intact

Cosmos Hub (ATOM) price rebounds, trading above $2.05 at the time of writing on Wednesday, after undergoing a sharp correction since last week. Weakening on-chain and derivatives data support a bearish outlook, while technical analysis remains unfavorable.