|
EUR/USD technical analysis: Euro rolling into the Asian session below the 1.1051 level
- EUR/USD is ending Monday little changed, trading below the 1.1051 level.
- The level to beat for sellers is the 1.1028 support level.

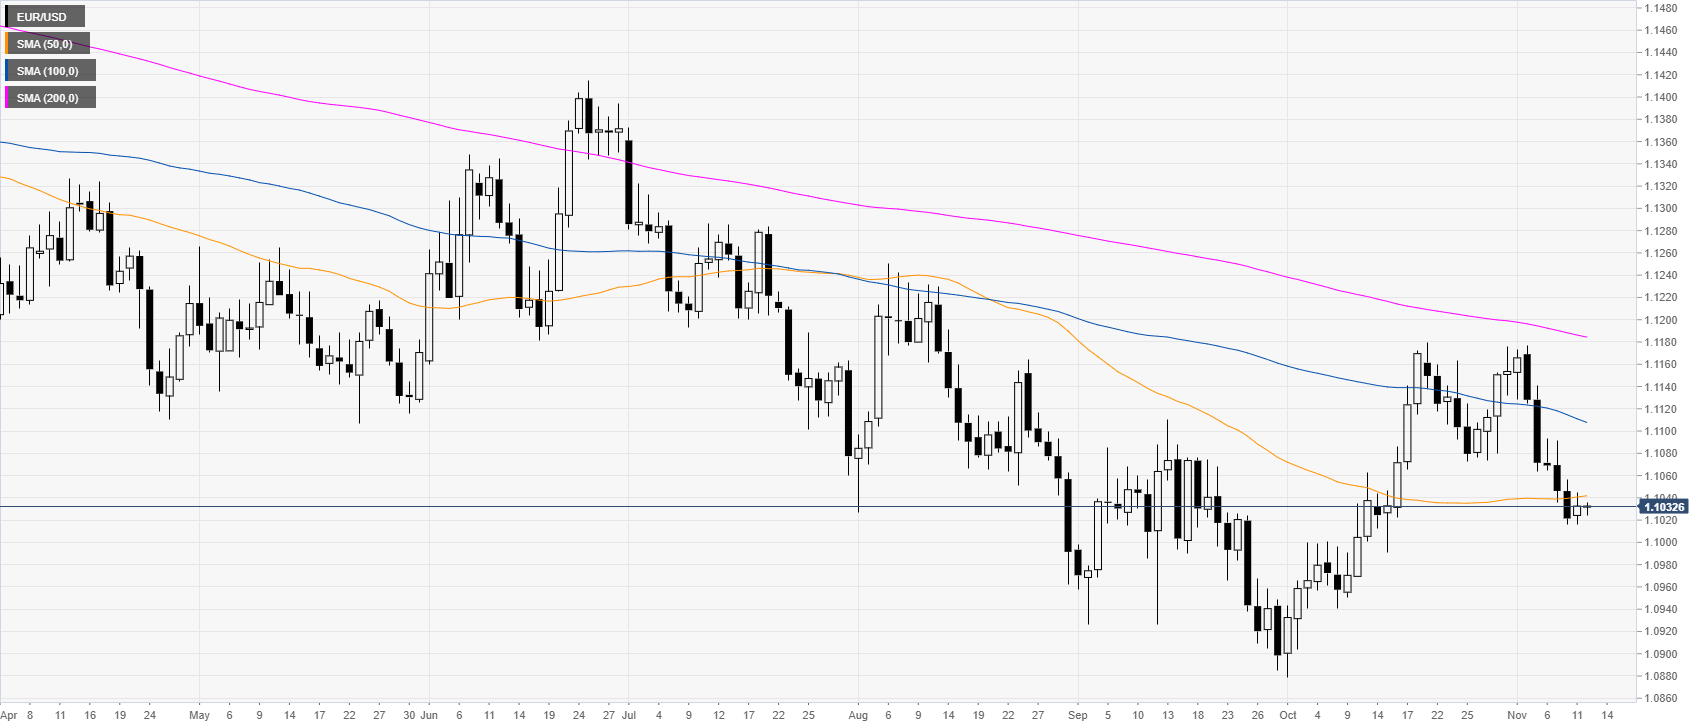
EUR/USD daily chart
The Fiber, on the daily chart, is trading in a bear trend below its main daily simple moving averages (DMAs). The Fiber, last week, after registering its worst weekly drop since August, is starting the week pulling back up, slightly.
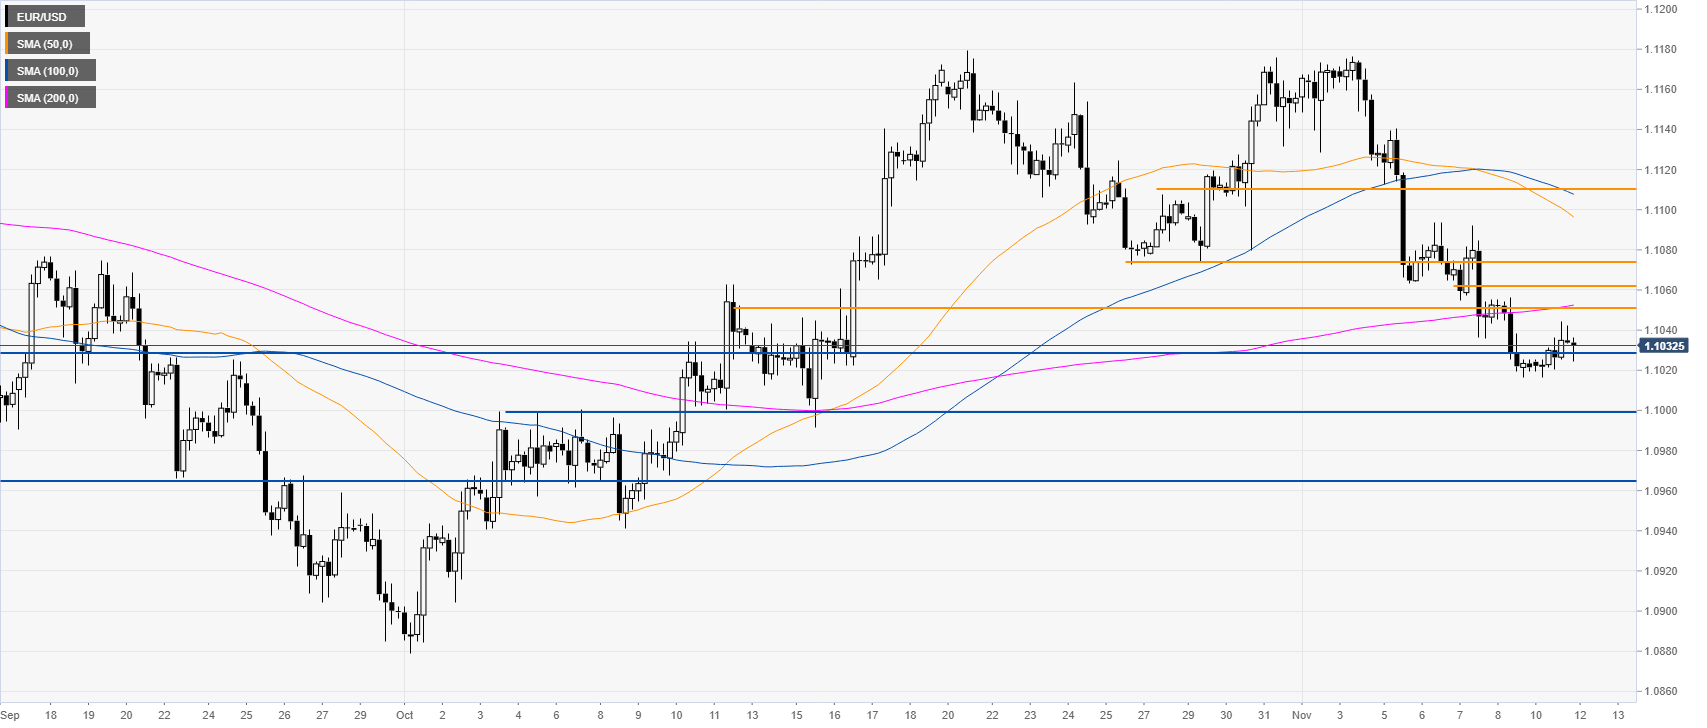
EUR/USD four-hour chart
The Euro remains under selling pressure below the main SMAs on the four-hour chart. The market is weak and a break below 1.1028 support level could open the doors to further losses towards the 1.1000 figure and the 1.0965 price level, according to the Technical Confluences Indicator.
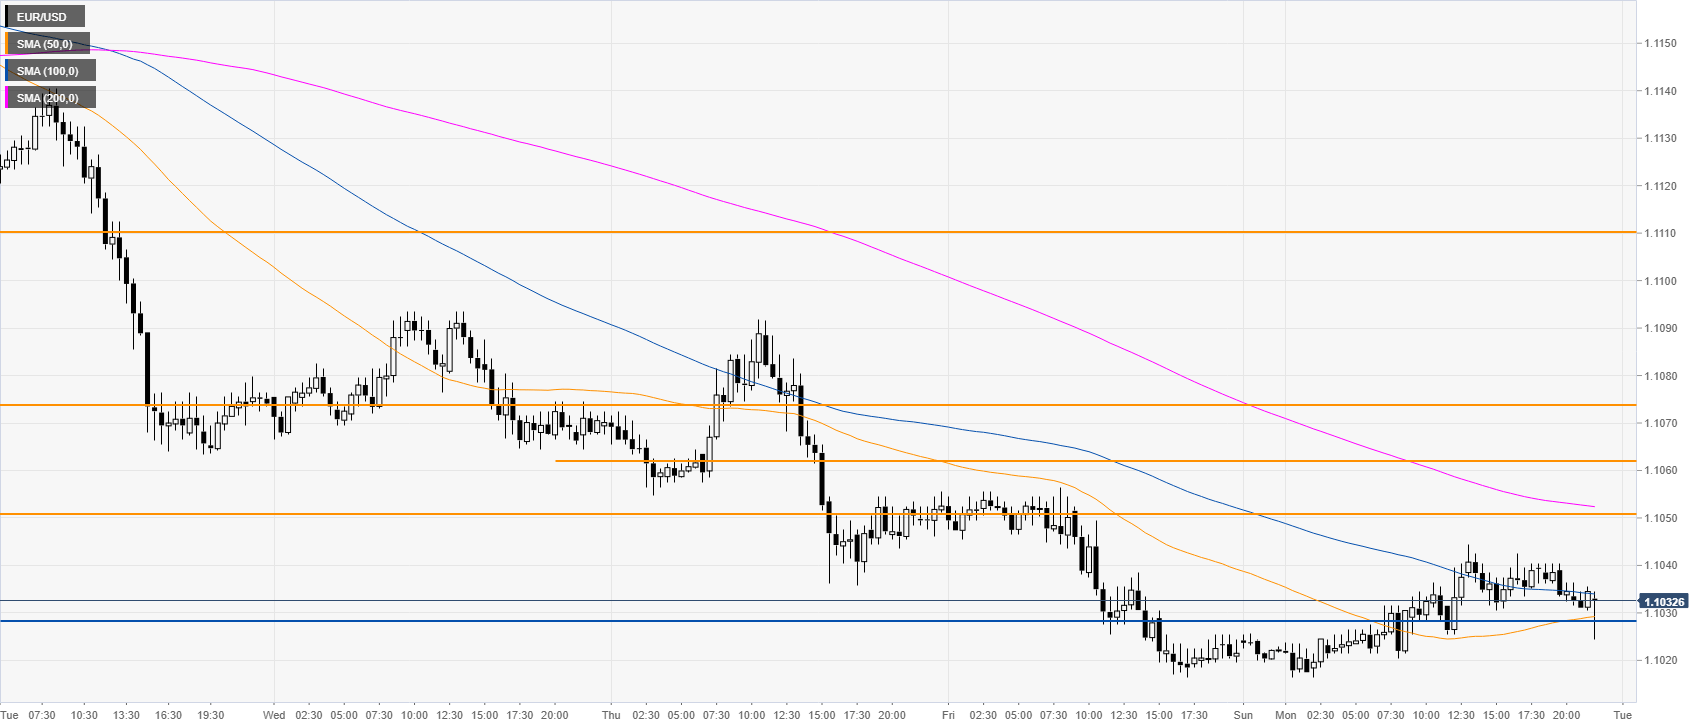
EUR/USD 30-minute chart
EUR/USD is trading below the 100 and 200 SMAs, suggesting a bearish momentum in the near term. Resistance is seen at the 1.1051 level and at the 1.1063/74 resistance zone, according to the Technical Confluences Indicator.
Additional key levels
Author

Flavio Tosti
Independent Analyst
More from Flavio Tosti


