EUR/USD Technical Analysis: Euro rises above 1.1400 figure - Can it last?

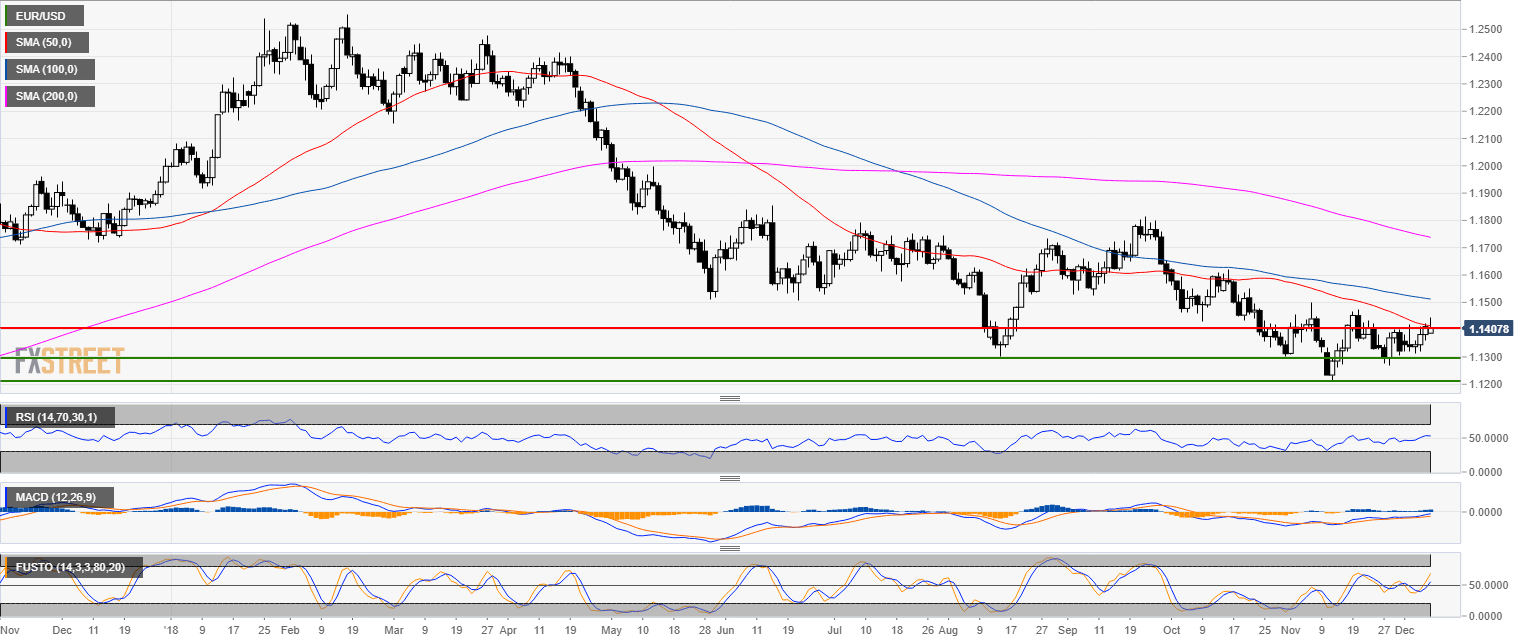
EUR/USD daily chart
- EUR/USD is trading in a bear trend below the 100 and 200-day simple moving average (SMA) while the market is testing the 50 SMA.
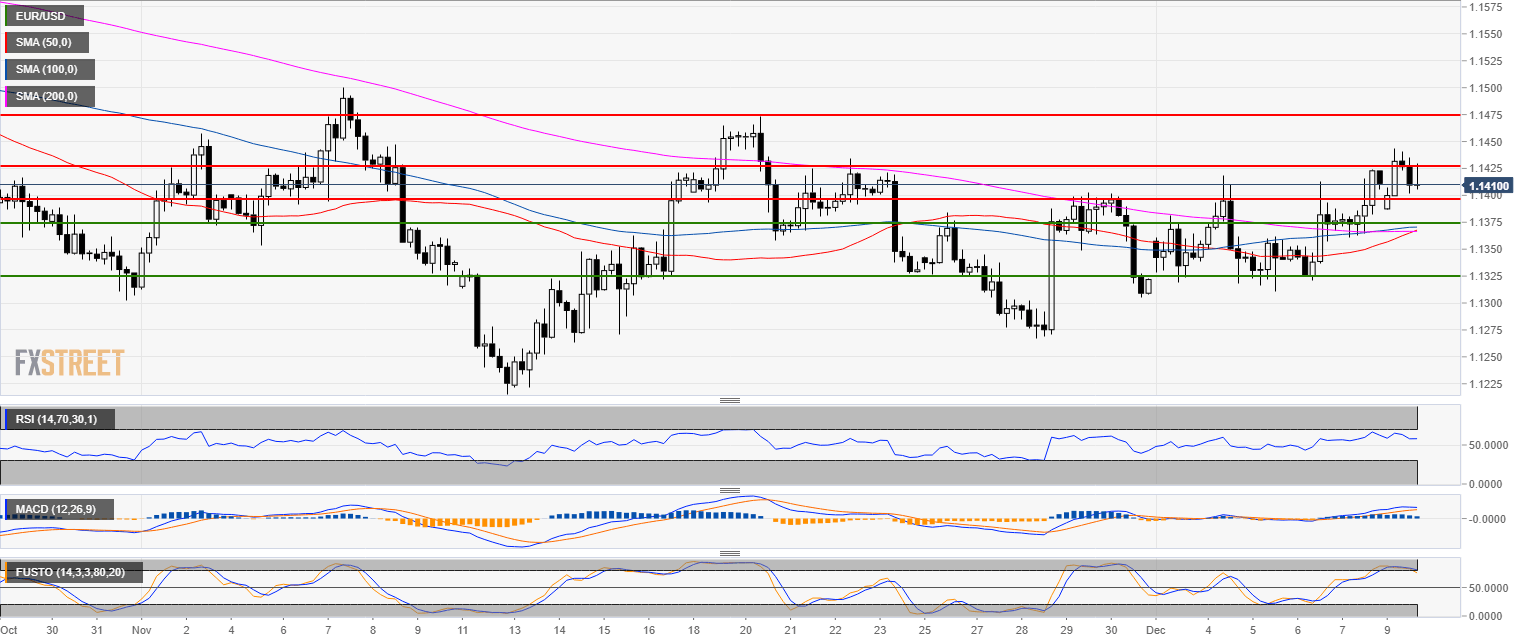
EUR/USD 4-hour chart
- EUR/USD moved above 1.1400 and tested the 1.1425 level.
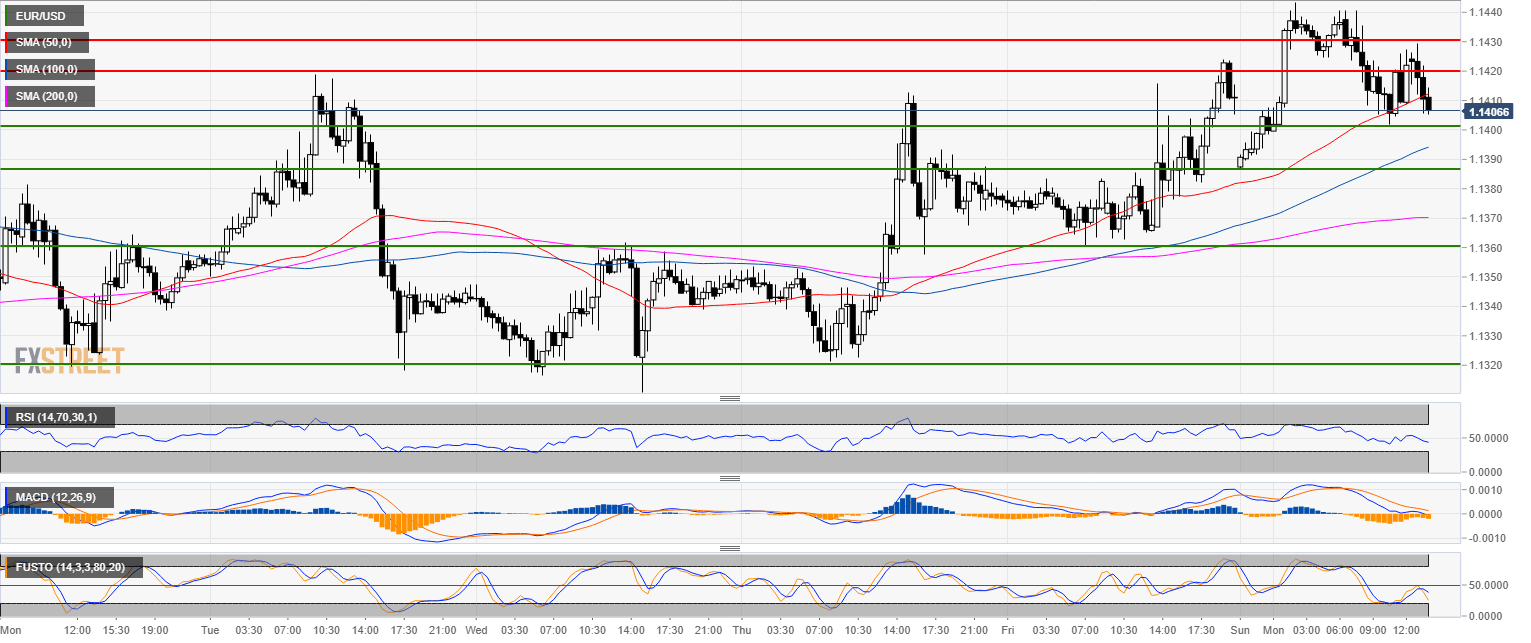
EUR/USD 30-minute chart
- On small time frames, the momentum is bearish.
- 1.1388 and the 1.1360 levels should be next targets to the downside.
Additional key levels
EUR/USD
Overview:
Today Last Price: 1.141
Today Daily change: -1.0 pips
Today Daily change %: -0.00876%
Today Daily Open: 1.1411
Trends:
Previous Daily SMA20: 1.1353
Previous Daily SMA50: 1.1417
Previous Daily SMA100: 1.1515
Previous Daily SMA200: 1.1742
Levels:
Previous Daily High: 1.1424
Previous Daily Low: 1.136
Previous Weekly High: 1.1424
Previous Weekly Low: 1.1311
Previous Monthly High: 1.15
Previous Monthly Low: 1.1216
Previous Daily Fibonacci 38.2%: 1.14
Previous Daily Fibonacci 61.8%: 1.1385
Previous Daily Pivot Point S1: 1.1373
Previous Daily Pivot Point S2: 1.1335
Previous Daily Pivot Point S3: 1.131
Previous Daily Pivot Point R1: 1.1437
Previous Daily Pivot Point R2: 1.1462
Previous Daily Pivot Point R3: 1.15
Author

Flavio Tosti
Independent Analyst


