|

EUR/USD Technical Analysis: Euro is weakening as bears are en route towards the 1.1400 figure
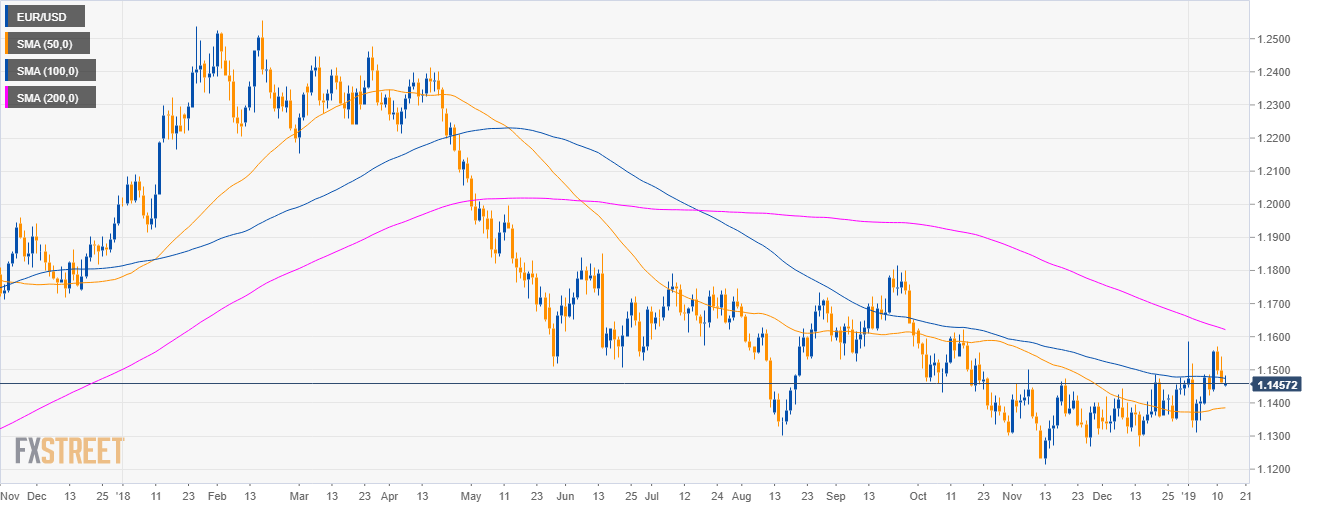
EUR/USD daily chart

  • EUR/USD is trading in a bear trend below its main simple moving averages (SMAs). 
  • EUR/USD bears are trading just below the 1.1500 figure and the 100 SMA.

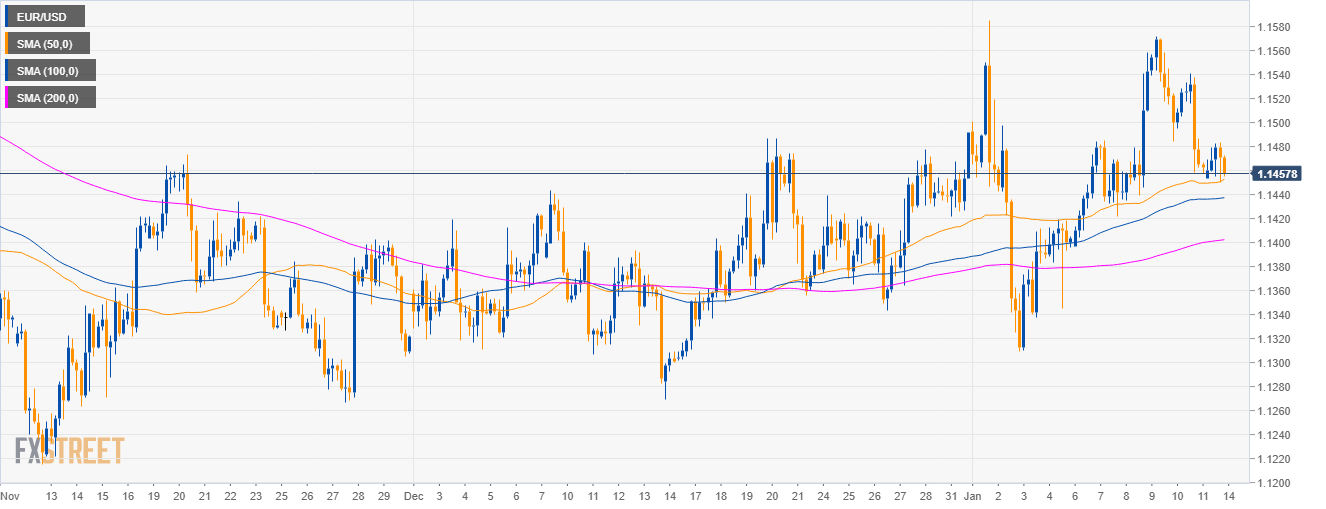
EUR/USD 4-hour chart

  • EUR/USD is trading above the main SMAs.

EUR/USD 30-minute chart

  • EUR/USD is trading below its main SMAs as bears are trying to break below the 1.1450 level.
  • A break below the current support would open the doors to 1.1400 the figure.
  • Resistance is seen at the 1.1480 and 1.1500 level.

Additional key levels

EUR/USD

Overview:
    Today Last Price: 1.146
    Today Daily change: -3.0 pips
    Today Daily change %: -0.0262%
    Today Daily Open: 1.1463
Trends:
    Previous Daily SMA20: 1.1423
    Previous Daily SMA50: 1.1384
    Previous Daily SMA100: 1.1476
    Previous Daily SMA200: 1.1627
Levels:
    Previous Daily High: 1.1541
    Previous Daily Low: 1.1458
    Previous Weekly High: 1.1571
    Previous Weekly Low: 1.1396
    Previous Monthly High: 1.1486
    Previous Monthly Low: 1.1269
    Previous Daily Fibonacci 38.2%: 1.1489
    Previous Daily Fibonacci 61.8%: 1.1509
    Previous Daily Pivot Point S1: 1.1434
    Previous Daily Pivot Point S2: 1.1404
    Previous Daily Pivot Point S3: 1.1351
    Previous Daily Pivot Point R1: 1.1516
    Previous Daily Pivot Point R2: 1.157
    Previous Daily Pivot Point R3: 1.1599

Author

Flavio Tosti

Flavio Tosti

Independent Analyst


More from Flavio Tosti
Share:

Editor's Picks

EUR/USD challenges 1.1700, six-week lows

EUR/USD remains under heavy downside pressire in quite a dfrreadful start to the new trading week, putting the 1.1700 support to the test amid the marked rebound in the US Dollar. The flight-so-safety environment continues to support the Greenback following the escalating conflict in the Middle East.

GBP/USD hits new yearly lows near 1.3300

GBP/USD adds to the recent bearish tone, approaching to the key 1.3300 support to reach fresh YTD troughs against the backdrop of the robust performance of the US Dollar. Indeed, Cable’s decline comes amid the firm demand for the safe-haven space in the wake of the US and Israel attacks to Iran.

Gold shifts its attention to $5,600 on fligh-to-safety mood

Gold climbs to levels last seen in late January past the $5,400 mark per troy ounce on Monday. The yellow metal’s strong uptick remains fuelled by incresing geopolitical tensions in the Middle East and the consequent demand for safer assets.

Bitcoin on brink of breakdown amid US-Iran war

Bitcoin (BTC) remains under pressure near the key support level of $65,700. Trading at $66,400 at the time of writing on Monday, a breakdown below this critical level would suggest a deeper correction ahead.

The week ahead: Conflict in the Middle East jolts markets

Events in the Middle East are obviously dominating financial markets this morning. The Brent crude oil price is extending gains and is higher by more than 8%, stock futures are pointing lower and the gold price is higher by more than 2%. 

Pi Network Price Forecast: Core team offloads supply, weighing on PI recovery

Pi Network  hovers below $0.1700, broadly steady at press time on Monday, attempting a recovery after a 2% loss the previous day. Sunday’s decline aligned with nearly 49 million PI tokens offloaded by the Pi Foundation, implying a spike in supply pressure that capped the prevailing four-day recovery.