|

EUR/USD technical analysis: Euro easing from October highs below 1.1160 level

  • The Greenback is starting to gain some traction at the end of the London session this Monday.
  • EUR/USD is trading near daily lows approaching the 1.1140 support. 
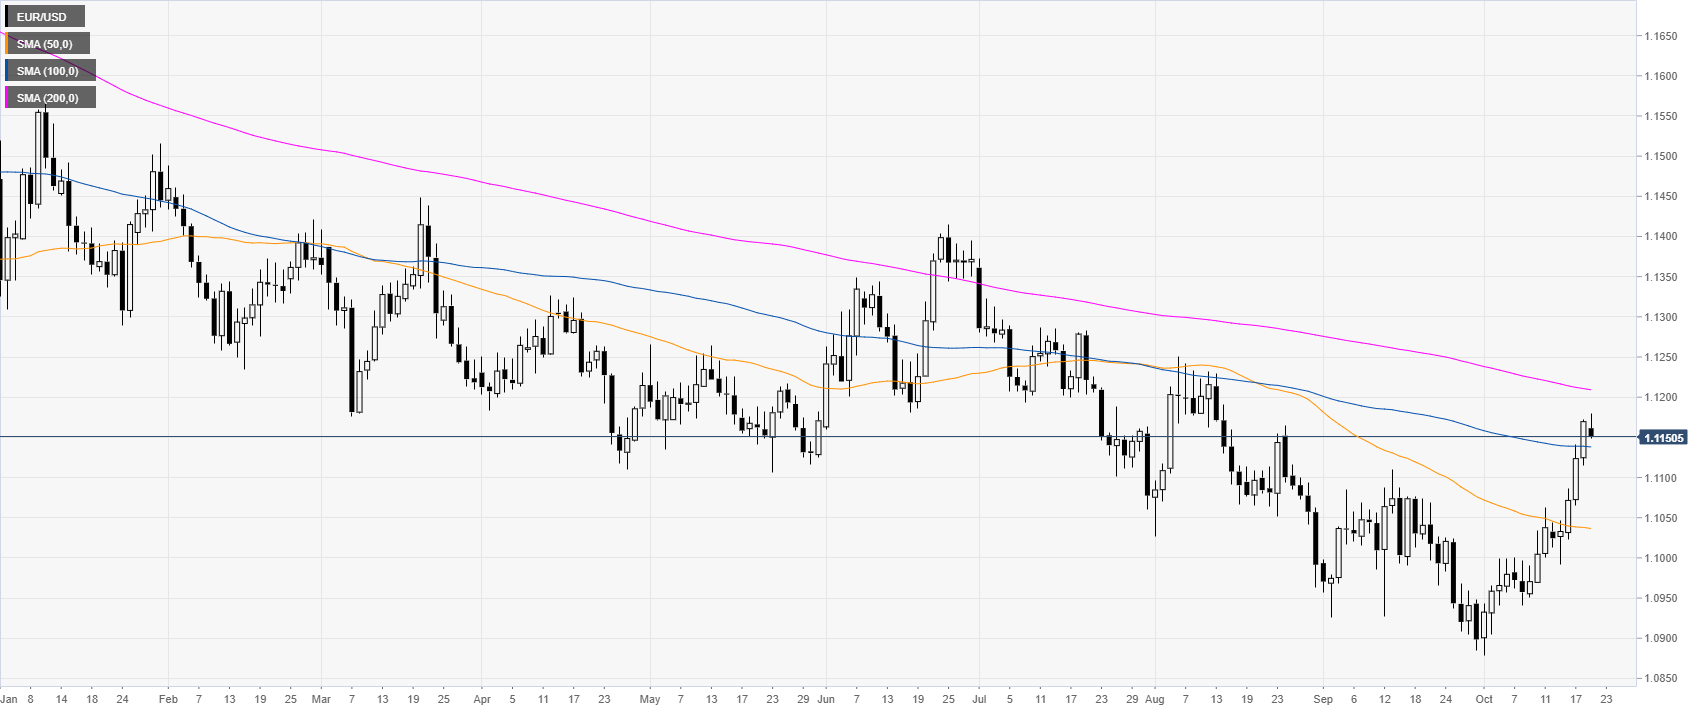
 

EUR/USD daily chart


On the daily chart, the common currency is trading in a bear trend below its 200-day simple moving averages (DSMAs). The Euro is starting the week trading mixed currently near its daily lows in the late London session. 

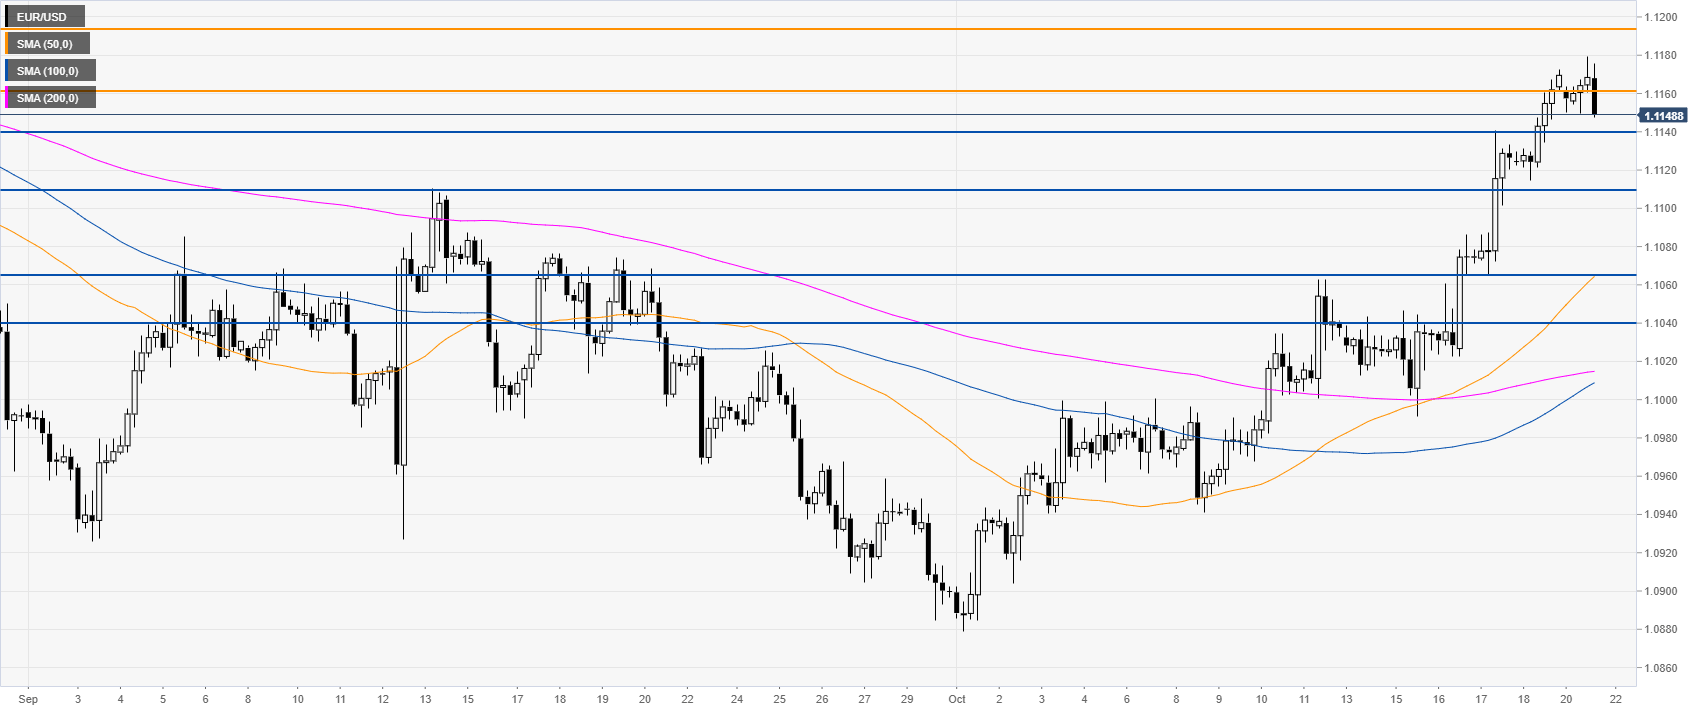
EUR/USD four-hour chart


The Euro is trading above its main SMAs, suggesting bullish momentum in the medium term. EUR/USD is easing from the October highs. Bulls would need to reclaim the 1.1160 resistance in order to travel towards the 1.1191 resistances on the way up, according to the Technical Confluences Indicator.
 

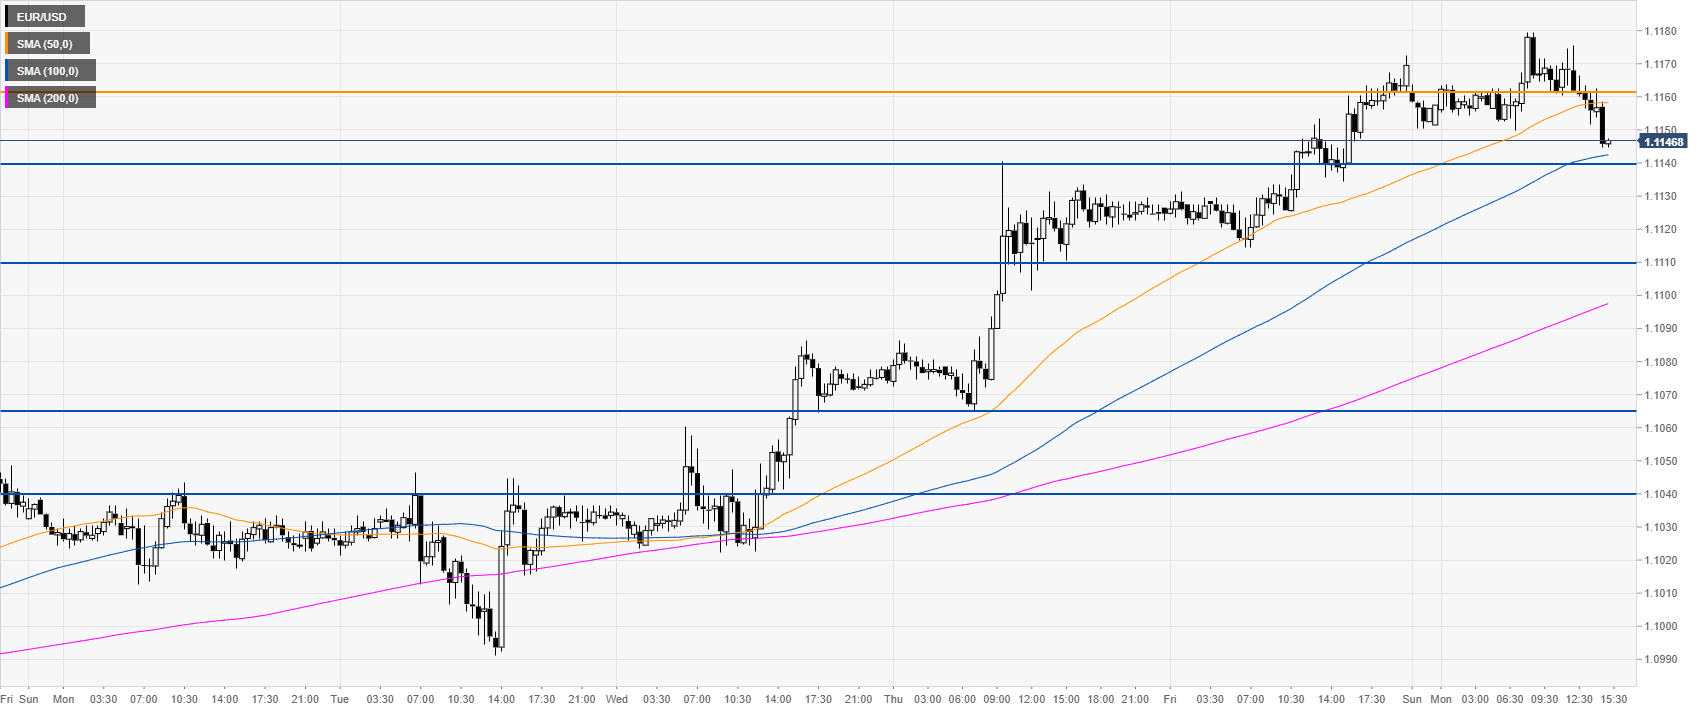
EUR/USD 30-minute chart


EUR/USD is trading between the 50 and 100 SMAs, suggesting a consolidation in the near term. Support can be seen at the 1.1140 and 1.1110 price levels. 
 

Additional key levels

EUR/USD

Overview
Today last price1.1146
Today Daily Change-0.0024
Today Daily Change %-0.21
Today daily open1.117
 
Trends
Daily SMA201.0998
Daily SMA501.1039
Daily SMA1001.1139
Daily SMA2001.1211
 
Levels
Previous Daily High1.1172
Previous Daily Low1.1114
Previous Weekly High1.1063
Previous Weekly Low1.0941
Previous Monthly High1.111
Previous Monthly Low1.0885
Daily Fibonacci 38.2%1.115
Daily Fibonacci 61.8%1.1137
Daily Pivot Point S11.1132
Daily Pivot Point S21.1094
Daily Pivot Point S31.1074
Daily Pivot Point R11.119
Daily Pivot Point R21.121
Daily Pivot Point R31.1248

Author

Flavio Tosti

Flavio Tosti

Independent Analyst


More from Flavio Tosti
Share:

Editor's Picks

EUR/USD treads water around 1.1900

EUR/USD edges a tad lower around the 1.1900 area, coming under mild pressure despite the US Dollar keeps the offered stance on turnaround Tuesday. On the US data front, December Retail Sales fell short of expectations, while the ADP four week average printed at 6.5K.

GBP/USD looks weak near 1.3670

GBP/USD trades on the back foot around the 1.3670 region on Tuesday. Cable’s modest retracement also comes in tandem with the decent decline in the Greenback. Moving forward, the US NFP and CPI data in combination with key UK releases should kee the quid under scrutiny in the next few days.

Gold the battle of wills continues with bulls not ready to give up

Gold comes under marked selling pressure on Tuesday, giving back part of its recent two day advance and threatening to challenge the key $5,000 mark per troy ounce. The yellow metal’s correction follows a better tone in the risk complex, a lower Greenback and shrinking US Treasuty yields.

AI Crypto Update: BankrCoin, Pippin surge as sector market cap steadies above $12B

The Artificial Intelligence (AI) segment is largely on the back foot with major coins such as Bittensor (TAO) and Internet Computer (ICP) extending losses amid a sticky risk-off sentiment.

Dollar drops and stocks rally: The week of reckoning for US economic data

Following a sizeable move lower in US technology Stocks last week, we have witnessed a meaningful recovery unfold. The USD Index is in a concerning position; the monthly price continues to hold the south channel support.

XRP holds $1.40 amid ETF inflows and stable derivatives market

Ripple trades under pressure, with immediate support at $1.40 holding at the time of writing on Tuesday. A recovery attempt from last week’s sell-off to $1.12 stalled at $1.54 on Friday, leading to limited price action between the current support and the resistance.