EUR/USD Technical Analysis: Clings to 38.2% Fibo, below 50-day SMA
- EUR/USD struggles to extend the recent downside.
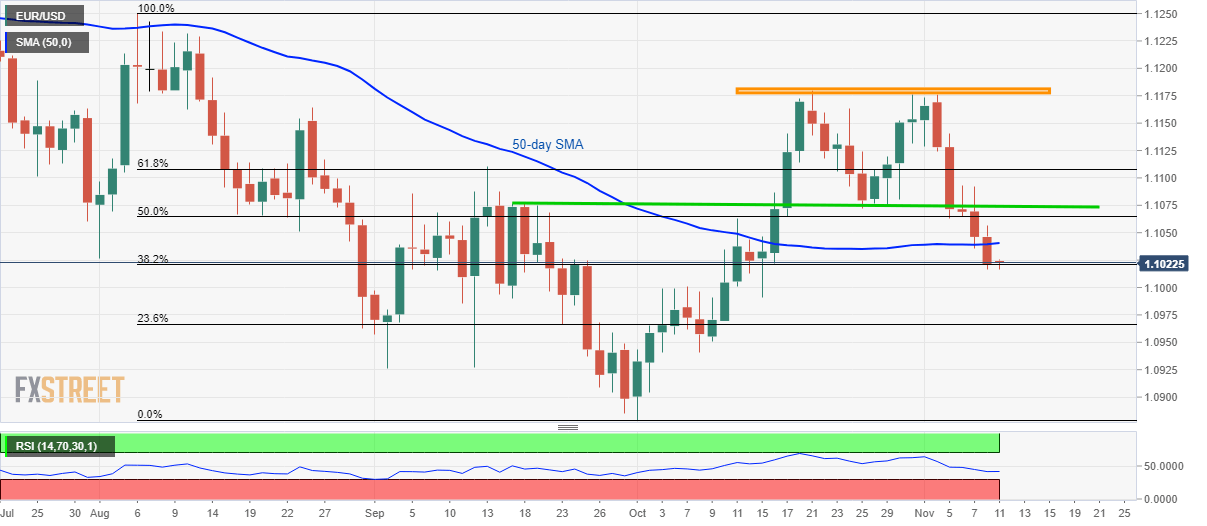
- AN upside clearance of 50-day SMA highlights 1.1070/75 support-turned-resistance.
- 1.1000, 1.0940 become the key rest-points.

EUR/USD sellers seem taking a hat around 38.2% Fibonacci retracement of August-October downpour as the quote seesaws near 1.1020 by the press time of early Monday.
Read: Spain’s Election update: Far right doubles seats in hung parliament, tough times ahead
Even so, buyers still stay away as 50-day Simple Moving Average (SMA) level of 1.1040 limits immediate upside, a break of which could trigger pair’s fresh run-up to 1.1070/75 area including mid-September highs and late-October lows.
If at all prices remain positive above 1.1075, 61.8% Fibonacci retracement level of 1.1110 and 1.1175/80 region comprising tops marked since October 21 will be crucial for the bulls.
Alternatively, pair’s sustained declines below 38.2% Fibonacci retracement level of 1.1020 makes it vulnerable to revisit 1.1000 mark while early-October lows near 1.0940 could gain bears’ attention afterward.
EUR/USD daily chart
Trend: pullback expected
Author

Anil Panchal
FXStreet
Anil Panchal has nearly 15 years of experience in tracking financial markets. With a keen interest in macroeconomics, Anil aptly tracks global news/updates and stays well-informed about the global financial moves and their implications.


