|

EUR/USD Technical Analysis: Bears driving the market towards daily lows
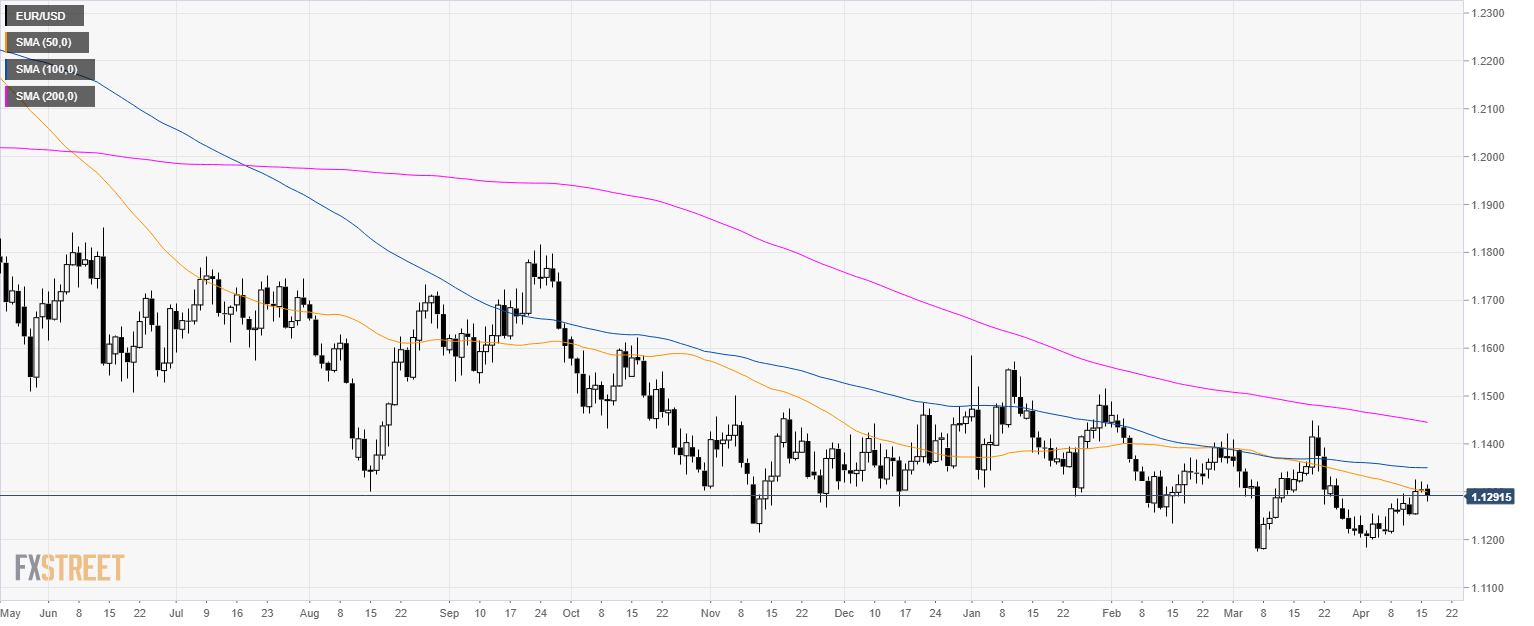
EUR/USD daily chart

  • EUR/USD is trading in a bear trend below its 200-day simple moving average (SMA).

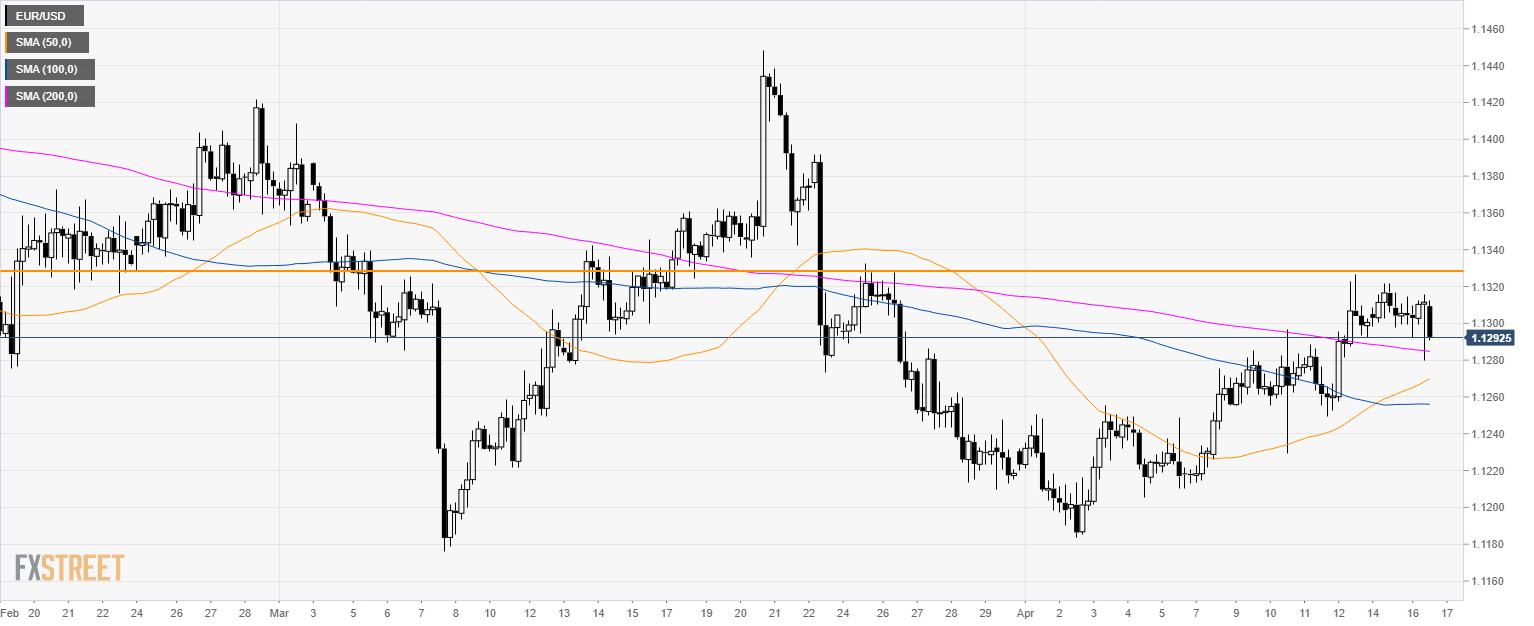
EUR/USD 4-hour chart

  • EUR/USD is trading above the main SMAs suggesting a bullish bias in the medium-term.

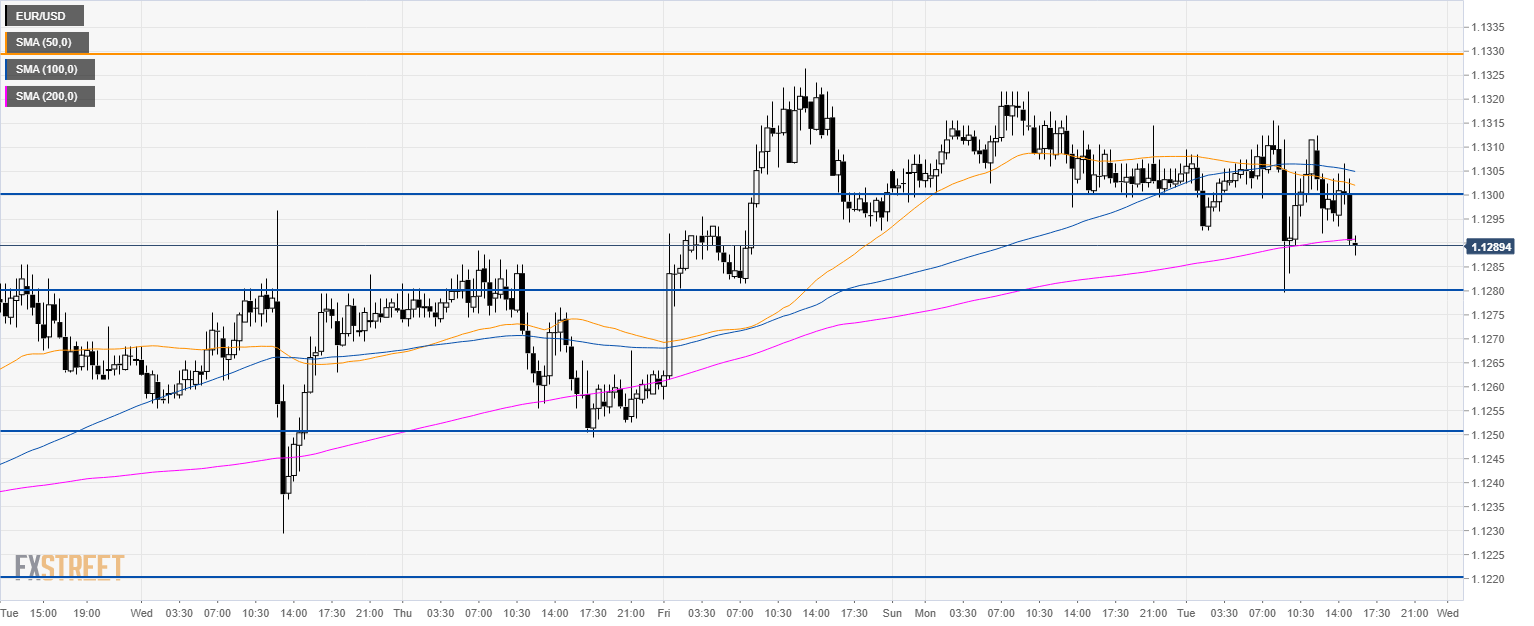
EUR/USD 30-minute chart

  • EUR/USD is trading below the 50 and 100 SMAs suggesting a correction down in the short-term.
  • The current break below 1.1300 should lead to 1.1280 and 1.1250 to the downside.
  • Key resistance is at 1.1330 followed by 1.1360 level.

Additional key levels

EUR/USD

Overview
Today last price1.1291
Today Daily Change-0.0013
Today Daily Change %-0.12
Today daily open1.1304
 
Trends
Daily SMA201.1273
Daily SMA501.1302
Daily SMA1001.135
Daily SMA2001.1447
Levels
Previous Daily High1.1322
Previous Daily Low1.1298
Previous Weekly High1.1326
Previous Weekly Low1.1213
Previous Monthly High1.1448
Previous Monthly Low1.1176
Daily Fibonacci 38.2%1.1307
Daily Fibonacci 61.8%1.1312
Daily Pivot Point S11.1293
Daily Pivot Point S21.1284
Daily Pivot Point S31.1269
Daily Pivot Point R11.1317
Daily Pivot Point R21.1331
Daily Pivot Point R31.1341

Author

Flavio Tosti

Flavio Tosti

Independent Analyst


More from Flavio Tosti
Share:

Editor's Picks

EUR/USD looks apathetic around 1.1770

EUR/USD comes under renewed pressure on Tuesday, deflating below the 1.1800 support and reversing two consecutive days of gains. The pair’s decline follows the persistent move higher in the US Dollar, as trade uncertainty dominates the sentiment ahead of President Trump’s SOTU speech.

GBP/USD regains 1.3500 and above

GBP/USD extends its advance for the third day in a row on Tuesday, this time retesting the area beyond the 1.3500 hurdle. Cable’s uptick comes despite decent gains in the Greenback and the dovish message from the BoE’s Bailey at the UK Parliament.

Gold appears offered around $5,150

Gold is giving back a good portion of the recent multi-day rally, receding to the $5,150 zone per troy ounce amid the decent bounce in the US Dollar and mixed US Treasuty yields. In the meantime, markets’ attention remain on upcoming comments from Fed speakers.

Ripple’s DeFi shift in focus: Navigating XRPL EVM sidechain growth, XRPFi migration and liquidity

Ripple (XRP) has continued to trade under pressure, extending its decline by approximately 63% from the record high of $3.66 in July. The remittance token is trading above support at $1.35, while its upside appears limited by key supply zones, starting with $1.40, at the time of writing on Tuesday.

The Citrini report: How a debatable AI narrative can shake Wall Street

That AI-related headline alone was enough to rattle investors.US stocks slid sharply on Monday after a widely circulated Citrini Research memo outlined a hypothetical “2028 Global Intelligence Crisis”, warning that rapid AI adoption could push US unemployment into double digits as early as by mid-2028.

XRP pressured by weak ETF flows and declining retail interest

Ripple (XRP) is edging lower, trading above its intraday low of $1.32 at the time of writing on Tuesday. The decline from its weekly opening of $1.39 reflects heightened volatility in the broader cryptocurrency market, accentuated by tariff-triggered uncertainty.