|

EUR/USD Price Analysis: Upside now targets the 200-day SMA

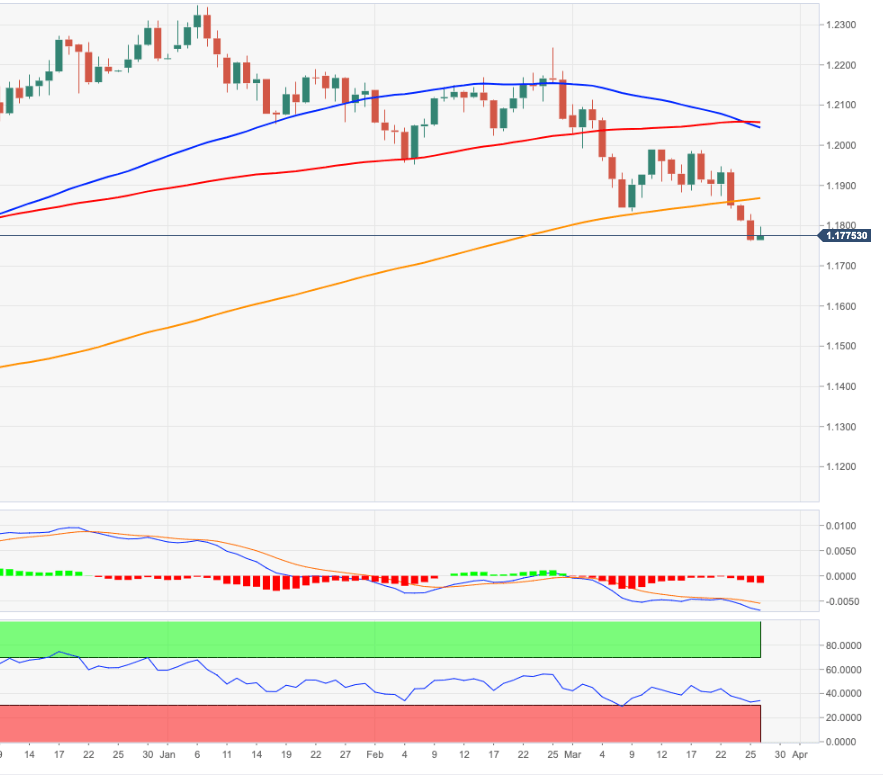
  • EUR/USD hits new 2021 lows in the 1.1760 zone.
  • The 200-day SMA near 1.1860 now emerges as the next hurdle.

EUR/USD’s weekly decline appears to have met a decent contention in the 1.1760 area, coincident with a Fibo level (of the November-January rally).

The recent breakdown of the 200-day SMA (1.1854) allows sellers to remain well in control of the sentiment surrounding the European currency, increasing the likelihood of further losses in the short-term horizon.

Below recent YTD lows around 1.1760 there are no relevant support levels until the November 2020 lows in the 1.1600 zone.

While below the 200-day SMA the short-term stance for EUR/USD is expected to remain negative.

EUR/USD daily chart

EUR/USD

Overview
Today last price1.1774
Today Daily Change35
Today Daily Change %0.09
Today daily open1.1764
 
Trends
Daily SMA201.1938
Daily SMA501.2039
Daily SMA1001.2058
Daily SMA2001.1865
 
Levels
Previous Daily High1.1828
Previous Daily Low1.1762
Previous Weekly High1.1989
Previous Weekly Low1.1874
Previous Monthly High1.2243
Previous Monthly Low1.1952
Daily Fibonacci 38.2%1.1787
Daily Fibonacci 61.8%1.1803
Daily Pivot Point S11.1741
Daily Pivot Point S21.1718
Daily Pivot Point S31.1675
Daily Pivot Point R11.1807
Daily Pivot Point R21.1851
Daily Pivot Point R31.1874

Author

Pablo Piovano

Born and bred in Argentina, Pablo has been carrying on with his passion for FX markets and trading since his first college years.

More from Pablo Piovano
Share:

Editor's Picks

EUR/USD flirts with weekly lows near 1.1770

EUR/USD now comes under further selling pressure, breaking below the 1.1800 support to challenge the area of weekly throughs near 1.1770 on Thursday. The pair’s decline comes in response to marked gains in the US Dollar amid steady geopolitical tensions. Ealier in the day, the ECB’s Lagarde delivered cautious remarks, although the currency remained apathetic.

GBP/USD threatens the 200-day SMA near 1.3440

GBP/USD rapidly leaves behind Wednesday’s strong advance, coming under heavy pressure and retesting the 1.3440 zone, where the critical 200-day SMA is located. Cable’s deep pullback follows the strong gains in the Greenback, while investors continue to pencil in a potential BoE rate cut in March.

Gold trims gains, slips back to around $5,170

Gold is now facing some downside pressure, hovering around the $5,170 region on Thursday. The yellow metal surrenders part of its earlier gains on the back of the resurgence of the buying interest in the Greenback. In the meantime, geopolitical tensions in the Middle East continue to limit the downside potential for now.

Stellar: Relief bounce fades as bearish undertone persists

Stellar is trading around $0.16 at the time of writing on Thursday after rebounding more than 8% in the previous day. Derivatives data paints a negative picture as XLM’s short bets hit a monthly high while Open Interest continues to decline.

Changing the game: International implications of recent tariff developments

The Supreme Court ruling on International Emergency Economic Powers Act (IEEPA) tariffs provides limited relief for the rest of the world, with weighted average tariff rates modestly lower.

Bitcoin steadies as traders eye US–Iran talks

Bitcoin (BTC) price is stabilizing around $68,000 at the time of writing on Thursday after a 6.2% relief rally the previous day amid a broader downward trend.