|

EUR/USD Price Analysis: Treads water below the major resistance of 1.0950

  • EUR/USD could test the immediate resistance of the 1.0950 level.
  • A break above the eight-week high of 1.0981 could lead the pair to test the psychological barrier of 1.1000.
  • The key support area appears around the 23.6% Fibonacci retracement of 1.0913 and the psychological level of 1.0900.

EUR/USD exhibits sideways movement amid a stable US Dollar (USD) following the upbeat US Nonfarm Payrolls released on Friday. The pair hovers around 1.0940 during the Asian trading hours on Monday, with an immediate resistance barrier at 1.0950 level followed by the eight-week high of 1.0981, marked in the previous session.

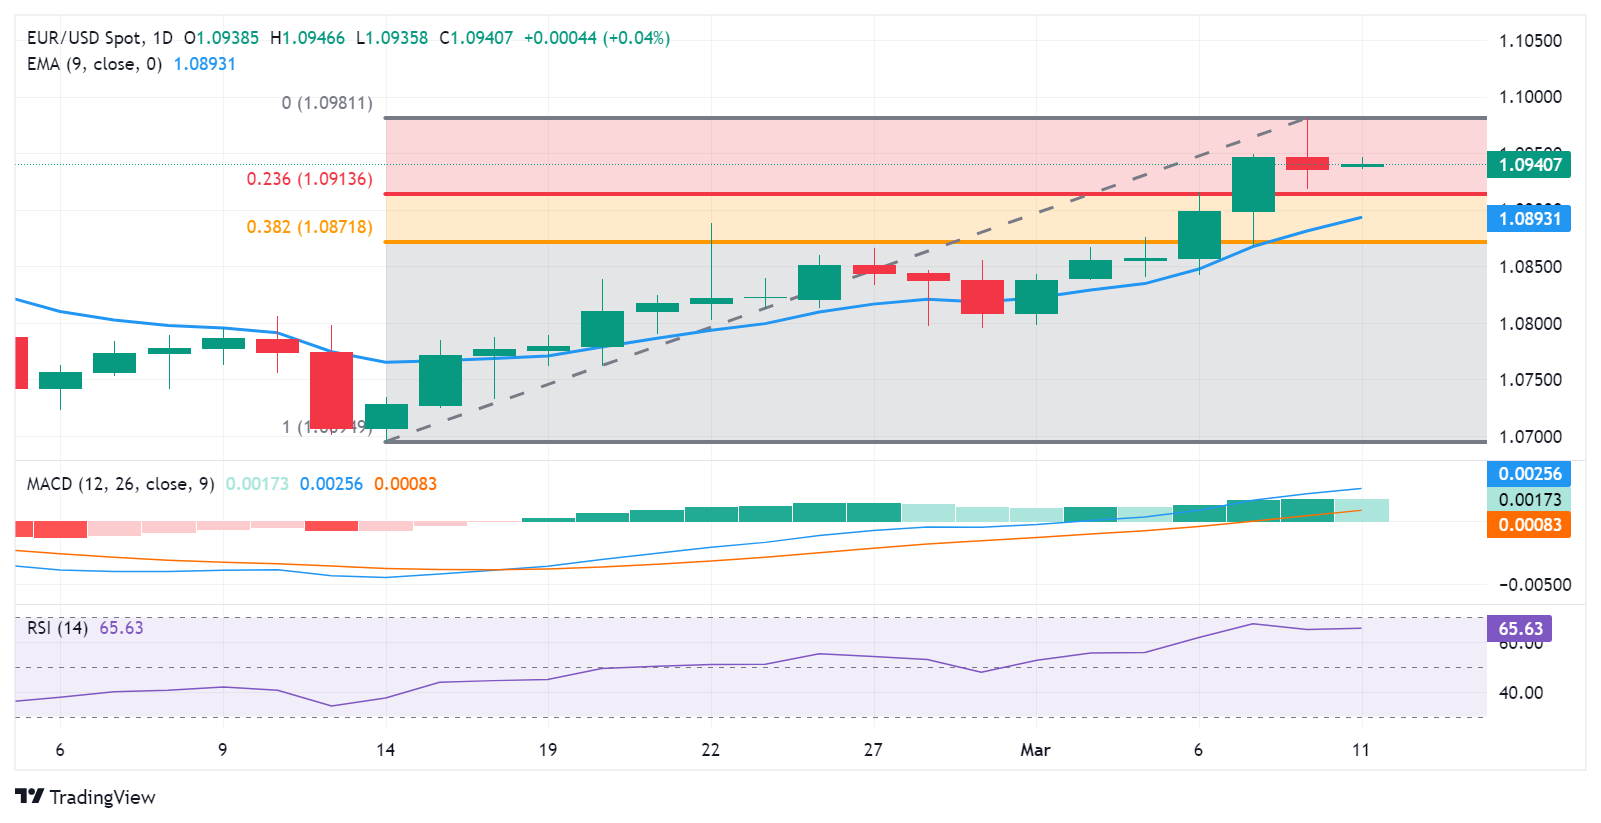
Technical analysis indicates a bullish sentiment for the EUR/USD pair. The 14-day Relative Strength Index (RSI) is positioned above the 50 mark. Moreover, the Moving Average Convergence Divergence (MACD) exhibits a divergence above the signal line and lies above the centerline. While a lagging indicator, this suggests a confirmation of the bullish momentum for the EUR/USD pair.

If there is a breakthrough above the recent highs, the EUR/USD pair may receive upward support, potentially testing the psychological barrier of 1.1000. Further exploration could lead to the area around January’s high of 1.1038 if surpassed.

On the downside, the EUR/USD pair could find the key support at 23.6% Fibonacci retracement of 1.0913 followed by the psychological level of 1.0900. A break below the latter could push the pair to test the nine-day Exponential Moving Average (EMA) at 1.0892 before the 38.2% Fibonacci retracement level of 1.0871 and the major support of 1.0850 level.

EUR/USD: Daily Chart

EUR/USD

Overview
Today last price1.094
Today Daily Change0.0004
Today Daily Change %0.04
Today daily open1.0936
 
Trends
Daily SMA201.0824
Daily SMA501.0856
Daily SMA1001.0842
Daily SMA2001.0834
 
Levels
Previous Daily High1.0981
Previous Daily Low1.0919
Previous Weekly High1.0981
Previous Weekly Low1.0838
Previous Monthly High1.0898
Previous Monthly Low1.0695
Daily Fibonacci 38.2%1.0943
Daily Fibonacci 61.8%1.0957
Daily Pivot Point S11.091
Daily Pivot Point S21.0883
Daily Pivot Point S31.0847
Daily Pivot Point R11.0972
Daily Pivot Point R21.1008
Daily Pivot Point R31.1034

Author

Akhtar Faruqui

Akhtar Faruqui is a Forex Analyst based in New Delhi, India. With a keen eye for market trends and a passion for dissecting complex financial dynamics, he is dedicated to delivering accurate and insightful Forex news and analysis.

More from Akhtar Faruqui
Share:

Markets move fast. We move first.

Orange Juice Newsletter brings you expert driven insights - not headlines. Every day on your inbox.

By subscribing you agree to our Terms and conditions.

Editor's Picks

EUR/USD remains below 1.1700 amid weakening momentum

EUR/USD remains steady after four days of losses, trading around 1.1680 during the Asian hours on Thursday. On the daily chart, the 14-day Relative Strength Index at 42.6 (neutral-bearish) indicates weakening momentum after slipping below the 50 midline. RSI staying sub-50 would keep bears engaged and limit recovery attempts.

GBP/USD consolidates above mid-1.3400s; bullish potential seems intact

The GBP/USD pair is seen consolidating its heavy losses registered over the past two days and oscillating in a narrow trading band, just above mid-1.3400s during the Asian session on Thursday. However, the fundamental backdrop warrants some caution for bearish traders and before positioning for an extension of the retracement slide from the 1.3565-1.3570 region, or the highest level since September 18, touched on Tuesday.

Gold: Deeper correction or dip-buying likely?

Gold is nursing losses near $4,450 in Asian trading on Thursday, having suffered about a 1% correction from weekly highs of $4,500 on Wednesday. All eyes remain on the geopolitical developments and the incoming US jobless claims data for fresh trading directives.

Top Crypto Losers: Pump.fun, Story, and Pudgy Penguins test key support levels

Pump.fun, Story, and Pudgy Penguins experience intense selling pressure over the last 24 hours. PUMP and IP failed to cross the 50-day Exponential Moving Average, resulting in a pullback on Wednesday, while PENGU is testing its 50-day EMA.

2026 economic outlook: Clear skies but don’t unfasten your seatbelts yet

Most years fade into the background as soon as a new one starts. Not 2025: a year of epochal shifts, in which the macroeconomy was the dog that did not bark. What to expect in 2026? The shocks of 2025 will not be undone, but neither will they be repeated.

XRP battles selling pressure as profit-taking, ETF inflows shape outlook

Ripple (XRP) is trading downward but holding support at $2.22 at the time of writing on Wednesday, as fear spreads across the cryptocurrency market, reversing gains made from the start of the year.