|

EUR/USD Price Analysis: The main challenge is the 55-day SMA

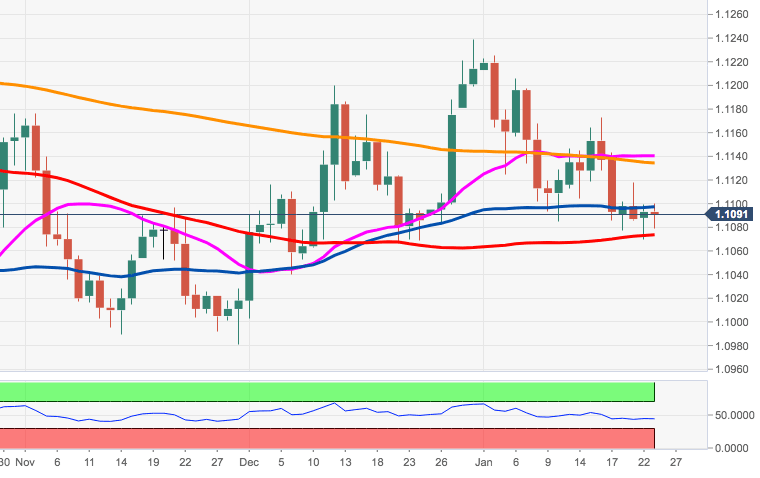
  • EUR/USD is hovering around the 55-day SMA near 1.1090.
  • Key support is located around 1.1070/60.

EUR/USD’s decline met decent contention in the proximity of 1.1070. This area of support is also reinforced by the 100-day SMA and the 3-month support line in the 1.1060/65 region.

The offered bias in the spot should alleviate somewhat above the 55-day SMA, today at 1.1091.

Further south emerges the 1.1040 area, early December lows.

EUR/USD daily chart

EUR/USD

Overview
Today last price1.1091
Today Daily Change20
Today Daily Change %-0.02
Today daily open1.1093
 
Trends
Daily SMA201.1143
Daily SMA501.1103
Daily SMA1001.1072
Daily SMA2001.1134
 
Levels
Previous Daily High1.1099
Previous Daily Low1.107
Previous Weekly High1.1173
Previous Weekly Low1.1086
Previous Monthly High1.124
Previous Monthly Low1.1002
Daily Fibonacci 38.2%1.1088
Daily Fibonacci 61.8%1.1081
Daily Pivot Point S11.1076
Daily Pivot Point S21.1058
Daily Pivot Point S31.1047
Daily Pivot Point R11.1105
Daily Pivot Point R21.1116
Daily Pivot Point R31.1134

Author

Pablo Piovano

Born and bred in Argentina, Pablo has been carrying on with his passion for FX markets and trading since his first college years.

More from Pablo Piovano
Share:

Editor's Picks

EUR/USD risks a deeper drop below 1.1750

EUR/USD keeps its vacillating mood in place as the the NA session drwas to a close on Tuesday, hovering below the 1.1800 hurdle amid acceptable gains in the US Dollar. In the meantime, market participants and the FX galaxy are expected to closely follow President Trump’s SOTU speech around 2AM GMT.
 

GBP/USD regains 1.3500 and above

GBP/USD extends its advance for the third day in a row on Tuesday, this time retesting the area beyond the 1.3500 hurdle. Cable’s uptick comes despite decent gains in the Greenback and the dovish message from the BoE’s Bailey at the UK Parliament.

Gold appears offered around $5,150

Gold is giving back a good portion of the recent multi-day rally, receding to the $5,150 zone per troy ounce amid the decent bounce in the US Dollar and mixed US Treasuty yields. In the meantime, markets’ attention remain on upcoming comments from Fed speakers.

Ripple’s DeFi shift in focus: Navigating XRPL EVM sidechain growth, XRPFi migration and liquidity
Ripple (XRP) has continued to trade under pressure, extending its decline by approximately 63% from the record high of $3.66 in July. The remittance token is trading above support at $1.35, while its upside appears limited by key supply zones, starting with $1.40, at the time of writing on Tuesday.
The Citrini report: How a debatable AI narrative can shake Wall Street

That AI-related headline alone was enough to rattle investors.US stocks slid sharply on Monday after a widely circulated Citrini Research memo outlined a hypothetical “2028 Global Intelligence Crisis”, warning that rapid AI adoption could push US unemployment into double digits as early as by mid-2028.

XRP pressured by weak ETF flows and declining retail interest

Ripple (XRP) is edging lower, trading above its intraday low of $1.32 at the time of writing on Tuesday. The decline from its weekly opening of $1.39 reflects heightened volatility in the broader cryptocurrency market, accentuated by tariff-triggered uncertainty.