|

EUR/USD Price Analysis: The hunt for the 1.0600 region

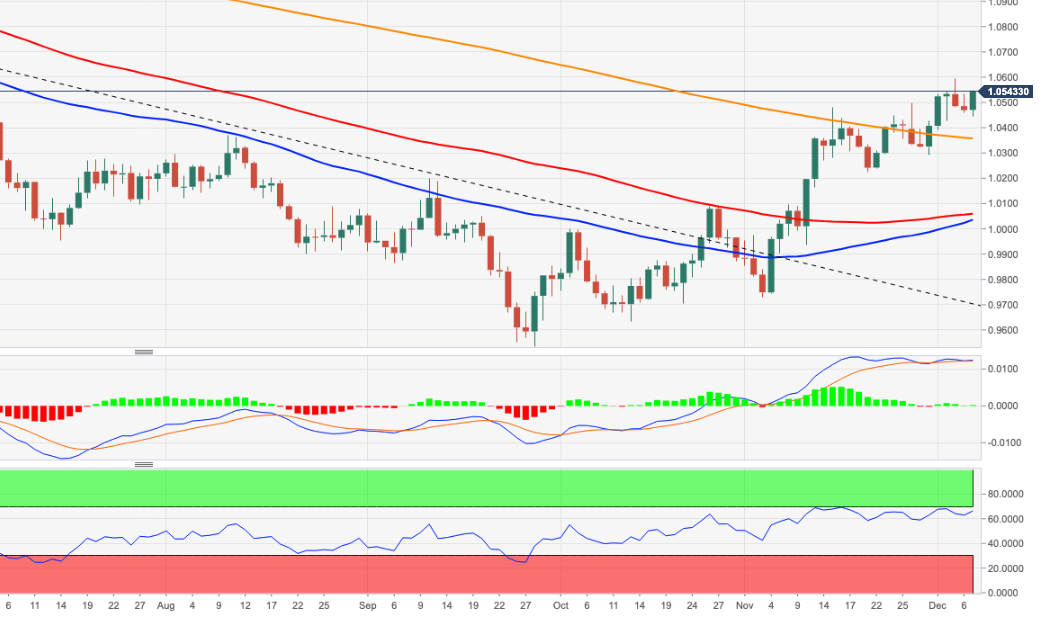
  • EUR/USD rises to 2-day highs and revisits the 1.0550 zone.
  • Further upside is expected to meet the next barrier at 1.0614.

EUR/USD reverses the weekly leg lower and reclaims the 1.0500 barrier and above on Wednesday.

Further upside in the pair is now likely to pick up pace following the recent surpass of the 200-day Simple Moving Average (SMA) and the 10-month resistance line. Against that, there are no resistance levels of note until the June high at 1.0614 (June 27).

Further upside in EUR/USD remains on the cards while above the 200-day SMA, today at 1.0355.

EUR/USD daily chart

EUR/USD

Overview
Today last price1.0543
Today Daily Change106
Today Daily Change %0.70
Today daily open1.047
 
Trends
Daily SMA201.0359
Daily SMA501.0055
Daily SMA1001.0056
Daily SMA2001.0361
 
Levels
Previous Daily High1.0533
Previous Daily Low1.046
Previous Weekly High1.0545
Previous Weekly Low1.029
Previous Monthly High1.0497
Previous Monthly Low0.973
Daily Fibonacci 38.2%1.0488
Daily Fibonacci 61.8%1.0505
Daily Pivot Point S11.0442
Daily Pivot Point S21.0414
Daily Pivot Point S31.0368
Daily Pivot Point R11.0515
Daily Pivot Point R21.0561
Daily Pivot Point R31.0589

Author

Pablo Piovano

Born and bred in Argentina, Pablo has been carrying on with his passion for FX markets and trading since his first college years.

More from Pablo Piovano
Share:

Editor's Picks

EUR/USD seems fragile below 1.1700 as Middle East war boosts energy prices

The EUR/USD pair trades flat at around 1.1680 during the Asian trading session on Tuesday, but broadly seems vulnerable, being close to its five-week low. The major currency pair is under pressure as surging oil prices due to the United States-Israel war with Iran have increased the risks of higher inflation for the Old Continent.

GBP/USD hovers around 1.3400 with bearish pressure intact

GBP/USD edges higher after three days of losses, trading around 1.3400 during the Asian hours on Tuesday. The technical analysis of the daily chart indicates an ongoing bearish bias, as the pair trades within a descending channel pattern.

Gold stays bullish as Iran war continues to spur safe-haven flows

Gold is finding renewed bids in Asian trades on Tuesday, making another attempt to regain the $5,400 level amid persistent demand for safe-haven assets as the Iran war extends. A softer risk tone remains in play as US President Donald Trump continues to threaten deeper escalation to the ongoing war with Iran, warning that a “big wave” is yet to come.

Top Crypto Gainers: Near Protocol, Virtuals Protocol, and Morpho lead market recovery

Near Protocol, Virtuals Protocol, and Morpho are leading the market recovery with double-digit gains over the last 24 hours. Technically, NEAR extends the breakout of the falling channel pattern, VIRTUAL holds above the 50-day EMA, while MORPHO tests a crucial resistance. 

The market is not panicking it is repricing the probability distribution of Oil and time

At the end of the day, markets do not trade morality or geopolitics. They trade transmission channels. And the only channel that truly matters in this maelstrom runs through the price of energy and the time value of money.

Grass 20% bullish breakout defies broader market weakness

Grass (GRASS) is edging up above $0.30 at the time of writing on Monday. The token’s notable 20% intraday surge stands out amid heightened volatility in the broader crypto market.