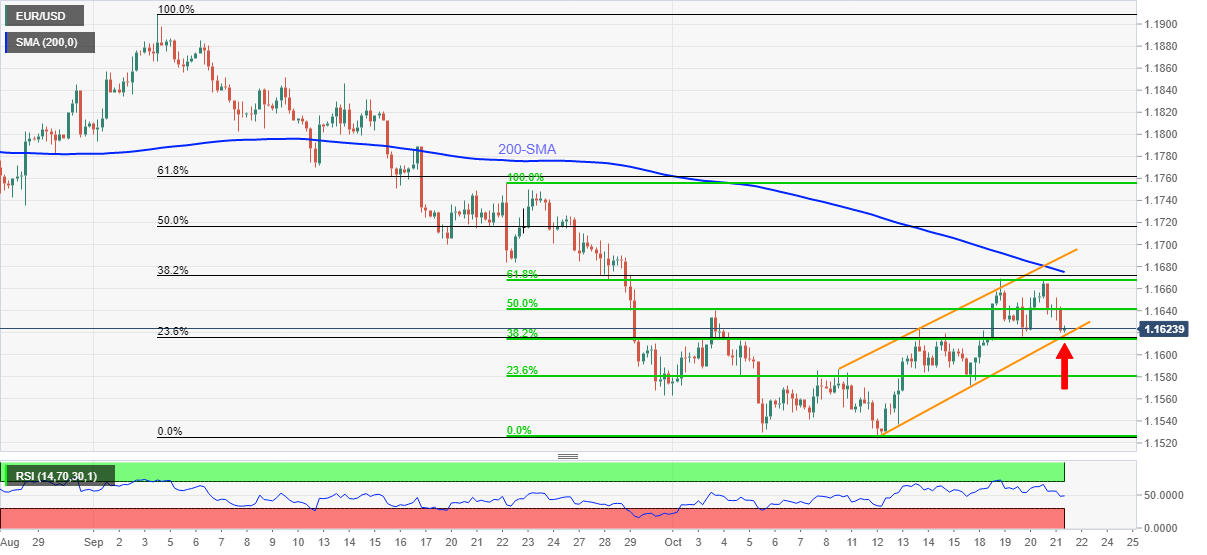
EUR/USD Price Analysis: Sellers attack 1.1620-15 key support


  • EUR/USD holds lower grounds inside fortnight-old rising channel formation.
  • Convergence of Fibonacci retracements, channel’s support restricts immediate downside.
  • Descending RSI joins double tops around 1.1665-70 to keep bears hopeful.

EUR/USD fades bounce off 1.1620 amid a quiet start to Friday’s Asian session. In doing so, the major currency pair remains near crucial support confluence following its rejection from an important short-term Fibonacci retracement (Fibo.) level, namely 61.8% Fibo. of September 22 to October 12 downturn.

Given the descending RSI conditions and a double top around 1.1665-70, not to forget sustained trading below 200-SMA, EUR/USD prices are likely to remain weak.

However, the support line of a two-week-old ascending trend channel joins 38.2% Fibonacci retracement of the stated short-term moves, also 23.6% Fibo. level of a decline from early September, restrict the quote’s immediate downside around 1.1620-15.

Hence, a clear break of the stated support level becomes necessary for the EUR/USD bears to aim for the yearly low surrounding 1.1525. Though, the 1.1570 level may act as a buffer during the fall.

Meanwhile, recovery moves remain less important until crossing the 1.1665-70 level. Also challenging the EUR/USD bulls are the 200-SMA level of 1.1675 and the stated channel’s resistance line close to 1.1690.

Should the EUR/USD buyers manage to cross the 1.1690 hurdle, the late September highs near 1.1755 will be in focus.

EUR/USD: Four-hour chart

Trend: Further weakness expected

Additional important levels

Overview
Today last price 1.1626
Today Daily Change -0.0025
Today Daily Change % -0.21%
Today daily open 1.1651
 
Trends
Daily SMA20 1.1614
Daily SMA50 1.1713
Daily SMA100 1.1806
Daily SMA200 1.1923
 
Levels
Previous Daily High 1.1659
Previous Daily Low 1.1617
Previous Weekly High 1.1624
Previous Weekly Low 1.1524
Previous Monthly High 1.1909
Previous Monthly Low 1.1563
Daily Fibonacci 38.2% 1.1643
Daily Fibonacci 61.8% 1.1633
Daily Pivot Point S1 1.1626
Daily Pivot Point S2 1.1601
Daily Pivot Point S3 1.1584
Daily Pivot Point R1 1.1668
Daily Pivot Point R2 1.1684
Daily Pivot Point R3 1.1709


Share: Feed news

Information on these pages contains forward-looking statements that involve risks and uncertainties. Markets and instruments profiled on this page are for informational purposes only and should not in any way come across as a recommendation to buy or sell in these assets. You should do your own thorough research before making any investment decisions. FXStreet does not in any way guarantee that this information is free from mistakes, errors, or material misstatements. It also does not guarantee that this information is of a timely nature. Investing in Open Markets involves a great deal of risk, including the loss of all or a portion of your investment, as well as emotional distress. All risks, losses and costs associated with investing, including total loss of principal, are your responsibility. The views and opinions expressed in this article are those of the authors and do not necessarily reflect the official policy or position of FXStreet nor its advertisers. The author will not be held responsible for information that is found at the end of links posted on this page.

If not otherwise explicitly mentioned in the body of the article, at the time of writing, the author has no position in any stock mentioned in this article and no business relationship with any company mentioned. The author has not received compensation for writing this article, other than from FXStreet.

FXStreet and the author do not provide personalized recommendations. The author makes no representations as to the accuracy, completeness, or suitability of this information. FXStreet and the author will not be liable for any errors, omissions or any losses, injuries or damages arising from this information and its display or use. Errors and omissions excepted.

The author and FXStreet are not registered investment advisors and nothing in this article is intended to be investment advice.

Recommended content


Recommended content

Editors’ Picks

EUR/USD climbs to 10-day highs above 1.0700

EUR/USD climbs to 10-day highs above 1.0700

EUR/USD gained traction and rose to its highest level in over a week above 1.0700 in the American session on Tuesday. The renewed US Dollar weakness following the disappointing PMI data helps the pair stretch higher.

EUR/USD News

GBP/USD extends recovery beyond 1.2400 on broad USD weakness

GBP/USD extends recovery beyond 1.2400 on broad USD weakness

GBP/USD gathered bullish momentum and extended its daily rebound toward 1.2450 in the second half of the day. The US Dollar came under heavy selling pressure after weaker-than-forecast PMI data and fueled the pair's rally. 

GBP/USD News

Gold trims losses on disappointing US PMIs

Gold trims losses on disappointing US PMIs

Gold (XAU/USD) reclaims part of the ground lost and pares initial losses on the back of further weakness in the Greenback following disheartening US PMIs prints.

Gold News

Here’s why Ondo price hit new ATH amid bearish market outlook Premium

Here’s why Ondo price hit new ATH amid bearish market outlook

Ondo price shows no signs of slowing down after setting up an all-time high (ATH) at $1.05 on March 31. This development is likely to be followed by a correction and ATH but not necessarily in that order.

Read more

Germany’s economic come back

Germany’s economic come back

Germany is the sick man of Europe no more. Thanks to its service sector, it now appears that it will exit recession, and the economic future could be bright. The PMI data for April surprised on the upside for Germany, led by the service sector.

Read more

Forex MAJORS

Cryptocurrencies

Signatures