|

EUR/USD Price Analysis: Rising wedge lures Euro bears as Fed, ECB decisions loom, 1.0720 eyed

  • EUR/USD grinds lower within bearish chart formation ahead of US inflation, Fed and ECB announcements.
  • Looming bear cross on MACD, RSI retreat from overbought territory favor sellers.
  • 50-SMA adds strength to 1.0720 support; Euro buyers have a bumpy road to travel.

EUR/USD takes offers to refresh intraday low as it prints mild losses near 1.0745 while extending the previous day’s fall amid early Monday. In doing so, the major currency pair drops with a one-week-old rising wedge bearish chart formation after snapping a four-week downtrend in the last.

Also read: EUR/USD grinds near mid-1.0700s as Fed vs. ECB play gains attention

It’s worth noting that an impending bear cross on the MACD indicator and the RSI (14) line’s U-turn from the overbought territory, towards the 50.0 levels of late, add strength to the Euro pair’s downside bias.

However, a convergence of the 50-SMA and the aforementioned rising wedge’s bottom line, close to 1.0720, appears a tough nut to crack for the EUR/USD bears to crack.

Following that, the previous weekly low of around 1.0670 may act as an intermediate halt before directing the bears toward the yearly low marked in May surrounding 1.0635.

It should be observed that the rising wedge’s confirmation ultimately directs the Euro bears toward the theoretical target of around 1.0570.

Alternatively, EUR/USD recovery needs to defy the rising wedge bearish chart pattern by crossing the 1.0790 hurdle, quickly followed by the 1.0800 psychological resistance, to convince the Euro buyers.

Even so, multiple stops marked in late May around 1.0830 and 1.0845-50 can challenge the Euro pair buyers before giving them control.

EUR/USD: Four-hour chart
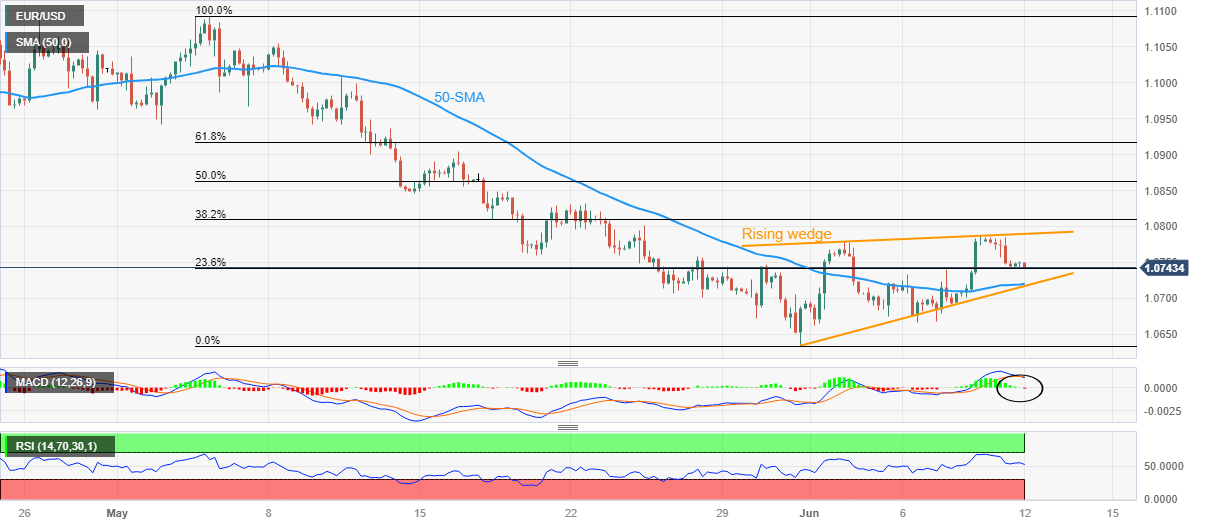
Trend: Further downside expected

Additional important levels

Overview
Today last price1.0742
Today Daily Change-0.0007
Today Daily Change %-0.07%
Today daily open1.0749
 
Trends
Daily SMA201.0759
Daily SMA501.0885
Daily SMA1001.0808
Daily SMA2001.052
 
Levels
Previous Daily High1.0785
Previous Daily Low1.0743
Previous Weekly High1.0787
Previous Weekly Low1.0667
Previous Monthly High1.1092
Previous Monthly Low1.0635
Daily Fibonacci 38.2%1.0759
Daily Fibonacci 61.8%1.0769
Daily Pivot Point S11.0733
Daily Pivot Point S21.0717
Daily Pivot Point S31.069
Daily Pivot Point R11.0775
Daily Pivot Point R21.0801
Daily Pivot Point R31.0817

Author

Anil Panchal

Anil Panchal

FXStreet

Anil Panchal has nearly 15 years of experience in tracking financial markets. With a keen interest in macroeconomics, Anil aptly tracks global news/updates and stays well-informed about the global financial moves and their implications.


More from Anil Panchal
Share:

Editor's Picks

AUD/USD seems vulnerable near 0.6800, 10-month low amid bullish USD

AUD/USD languishes near a 10-month low during the Asian session on Friday, awaiting a break below 0.6800 before the next leg up amid a bullish US Dollar. Firming Fed rate-hike expectations, along with fading hopes for US-Iran diplomacy, help the USD hold gains at its highest level since April 2025. Moreover, the RBA’s dovish tilt undermines the Aussie and backs the case for further losses.

USD/JPY bulls turn cautious near 160.00 amid intervention risks

USD/JPY enters a bullish consolidation phase around its highest level since early September as bulls turn cautious amid intervention risk near 160.00. Meanwhile, the downside seems cushioned as the wide US-Japan interest rate gap keeps the Yen carry trade active. Furthermore, the possibility of a jumbo Fed rate hike and Middle East uncertainties hold the US Dollar near a 19-month top, supporting the currency pair.


Gold sticks to gains above $3,900; bulls lack conviction as Fed and Iran risks support USD

Gold clings to modest recovery gains above the $3,900 mark during the Asian session, snapping its three-day losing streak to the lowest level since late September set the previous day. The US Dollar takes a breather after a strong three-day rally to its highest level since April 2025, offering some support to the commodity. However, firming US Federal Reserve rate-hike expectations and Middle East uncertainties continue to support the Greenback. This keeps a lid on any further upside for the precious metal.

Bitcoin slips below $70,000 for the first time since August

Bitcoin is attracting some serious sellers, pushing it below $70,000 on Friday after an over 3% decline the previous day. The Crypto King is down over 5% so far this week, and a bearish close could mark its sixth consecutive week of losses. The technical outlook for Bitcoin is bearish, with sellers tightening their grip despite overextending the downtrend to oversold levels.

Asian stocks post mixed results amid Nvidia leadership turmoil, Anthropic IPO buzz
Asian stocks post mixed results on Friday, with Japan’s Nikkei 225 Index climbing 0.91% to around 61,370 and China’s Shanghai Composite rising 0.22% to 3,660. Conversely, Hong Kong’s Hang Seng Index fell 0.82% to 23,810, while South Korea’s KOSPI declined 0.49% to near 5,320.
What the US CPI headline doesn’t tell you about inflation

Brent crude has fallen about a third since mid-October on hopes the Iran war is ending, but diesel, freight and fertiliser costs haven't followed. Those costs reach US consumer prices in stages through 2027 and could keep inflation high after gasoline gets cheaper.