|

EUR/USD Price Analysis: Pair retreats to 1.0525, losing key 20-day SMA support

  • EUR/USD declines by 0.33% on Tuesday, settling at 1.0525 after falling below the 20-day SMA.
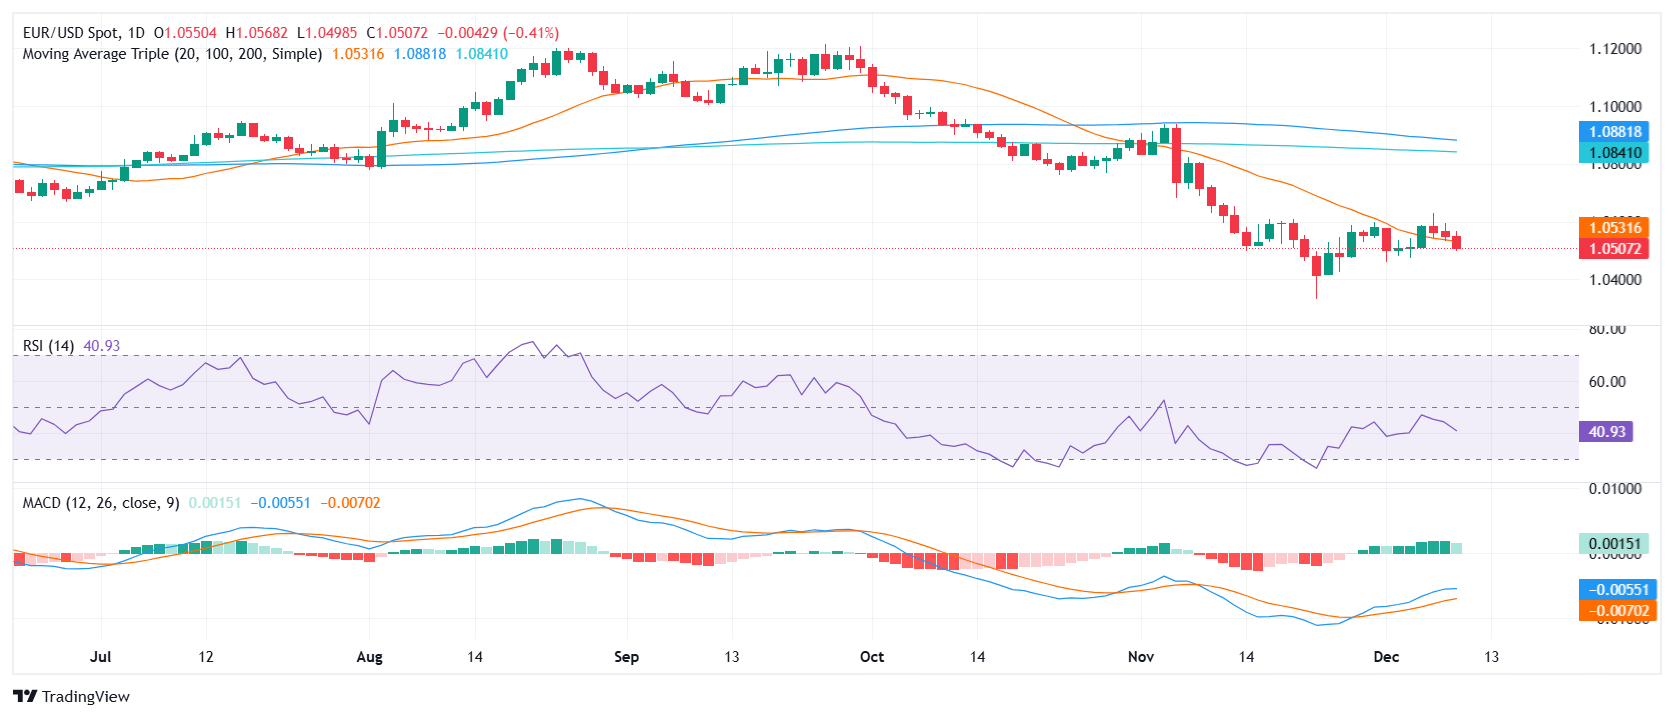
  • RSI drops sharply to 40, remaining in the negative area, signaling weakening momentum.
  • MACD histogram prints decreasing green bars, highlighting fading bullish traction.

The EUR/USD pair extended its losses on Tuesday, retreating to 1.0525 and slipping slightly below the 20-day Simple Moving Average (SMA). This development undermines the pair's short-term constructive outlook, raising concerns about further downside risks if the 20-day SMA is definitively breached.

Technical indicators point to a deteriorating momentum. The Relative Strength Index (RSI) has declined sharply to 40, signaling increased selling pressure and remaining firmly in the negative territory. Similarly, the Moving Average Convergence Divergence (MACD) histogram shows decreasing green bars, indicating fading bullish traction and reinforcing a bearish bias.

On the downside, the loss of the 20-day SMA around 1.0550 exposes the pair to further declines, with the next support levels at 1.0500 and 1.0480. For any recovery, EUR/USD must first regain the 20-day SMA and then break above the 1.0600 resistance level to revive the bullish case and shift momentum back in favor of the bulls.

EUR/USD daily chart

Author

Patricio Martín

Patricio is an economist from Argentina passionate about global finance and understanding the daily movements of the markets.

More from Patricio Martín
Share:

Editor's Picks

EUR/USD challenges 1.1700, six-week lows

EUR/USD remains under heavy downside pressire in quite a dfrreadful start to the new trading week, putting the 1.1700 support to the test amid the marked rebound in the US Dollar. The flight-so-safety environment continues to support the Greenback following the escalating conflict in the Middle East.

GBP/USD hits new yearly lows near 1.3300

GBP/USD adds to the recent bearish tone, approaching to the key 1.3300 support to reach fresh YTD troughs against the backdrop of the robust performance of the US Dollar. Indeed, Cable’s decline comes amid the firm demand for the safe-haven space in the wake of the US and Israel attacks to Iran.

Gold shifts its attention to $5,600 on fligh-to-safety mood

Gold climbs to levels last seen in late January past the $5,400 mark per troy ounce on Monday. The yellow metal’s strong uptick remains fuelled by incresing geopolitical tensions in the Middle East and the consequent demand for safer assets.

Bitcoin on brink of breakdown amid US-Iran war

Bitcoin (BTC) remains under pressure near the key support level of $65,700. Trading at $66,400 at the time of writing on Monday, a breakdown below this critical level would suggest a deeper correction ahead.

The week ahead: Conflict in the Middle East jolts markets

Events in the Middle East are obviously dominating financial markets this morning. The Brent crude oil price is extending gains and is higher by more than 8%, stock futures are pointing lower and the gold price is higher by more than 2%. 

Pi Network Price Forecast: Core team offloads supply, weighing on PI recovery

Pi Network  hovers below $0.1700, broadly steady at press time on Monday, attempting a recovery after a 2% loss the previous day. Sunday’s decline aligned with nearly 49 million PI tokens offloaded by the Pi Foundation, implying a spike in supply pressure that capped the prevailing four-day recovery.