EUR/USD Price Analysis: Pair holds firm near 1.13 after sharp rise
- EUR/USD trades near the 1.13 zone on Monday after a sharp intraday rise.
- The pair maintains a bullish bias despite mixed short-term signals.
- Key support is clustered below 1.1230, with resistance near 1.1280.

The EUR/USD pair is trading near the 1.13 zone on Monday, reflecting a strong intraday recovery as the market gains momentum after the European session. Despite the sharp upside move, the broader technical outlook presents a mixed picture, with conflicting signals across different timeframes. Short-term indicators suggest potential pullbacks, while the longer-term trend remains firmly bullish, providing a cautiously optimistic backdrop for the pair.
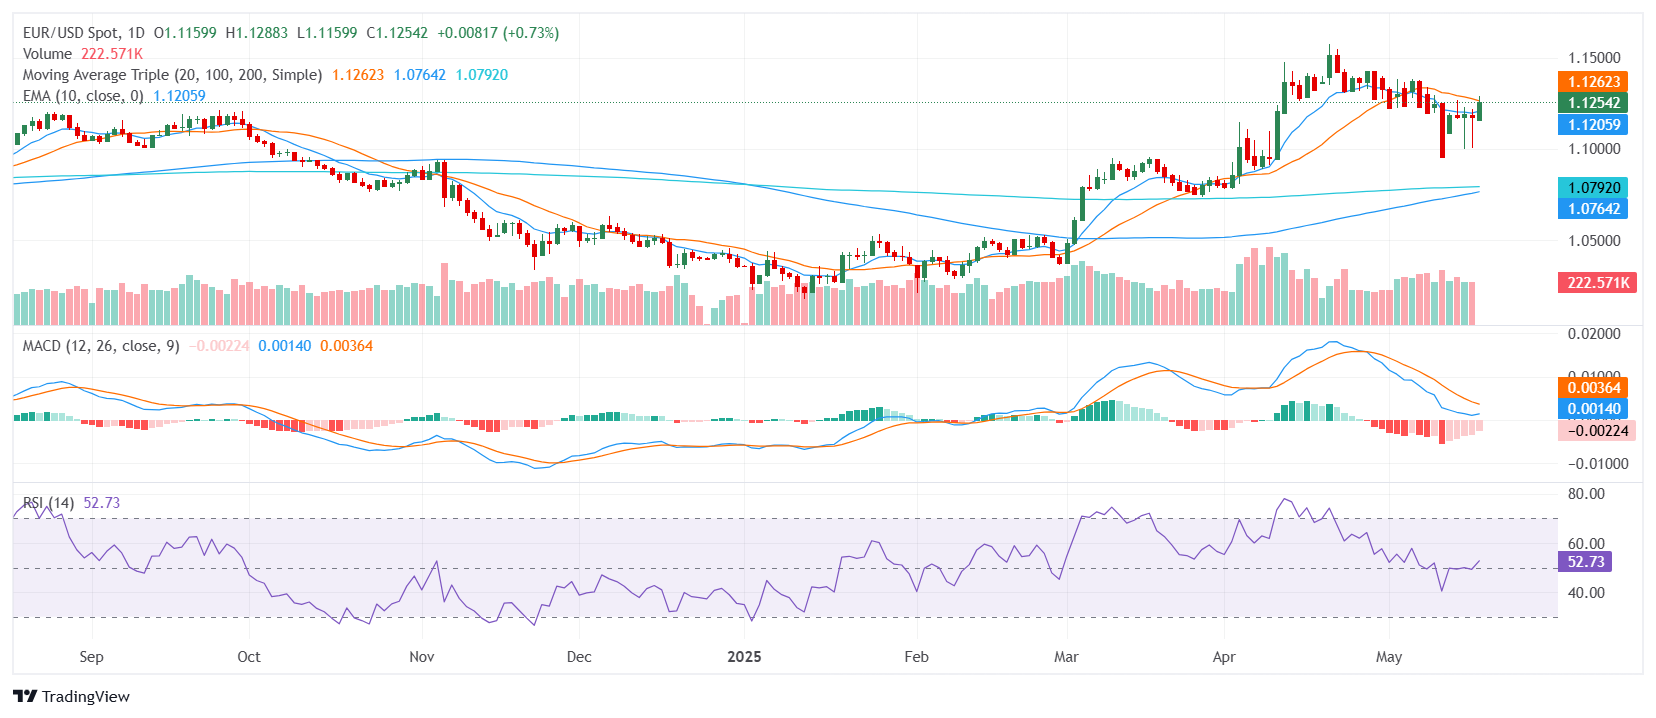
The daily technical setup reflects a complex, but overall positive, outlook. The Relative Strength Index (RSI) is in the 50s, signaling neutral momentum, while the Moving Average Convergence Divergence (MACD) still points to sell pressure, highlighting the potential for near-term consolidation. However, the Average Directional Index (14) in the 20s supports buying pressure, suggesting the pair might sustain its recent gains. The Williams Percent Range (14) and the Commodity Channel Index (20) also indicate neutral momentum, reinforcing the cautious tone.
Moving averages paint a more supportive long-term picture. The 10-day Exponential Moving Average (EMA) and the 10-day Simple Moving Average (SMA) are aligned with the current bullish sentiment, while the 100-day and 200-day SMAs confirm the broader upward bias. In contrast, the 20-day SMA remains in sell territory, acting as a potential headwind for the pair's recovery.
Shifting to the 4-hour timeframe, the outlook remains firmly bullish. The 4-hour MACD signals buy momentum, aligning with the broader daily trend, while the shorter-term 10 and 20-period EMAs and SMAs also indicate sustained buying interest. The Relative Strength Index (RSI) and Average Directional Index (ADI) on the 4-hour chart remain neutral, reflecting the current consolidation phase after the sharp move higher.
Immediate support is seen around 1.1230, with additional levels at 1.1220 and 1.1217. On the upside, resistance is likely to emerge around 1.1280, followed closely by 1.1282 and 1.1284. Broader Fibonacci levels place deeper support in the 1.0400 to 1.0900 range, while resistance extends toward 1.1500, 1.1700, and 1.2000, providing a wider context for potential breakout scenarios.
Daily Chart
Author

Patricio Martín
FXStreet
Patricio is an economist from Argentina passionate about global finance and understanding the daily movements of the markets.
















