|

EUR/USD Price Analysis: Next target emerges at 1.0180

  • EUR/USD reclaims part of the ground lost on Tuesday’s sell-off.
  • Further rebound should target the multi-month line near 1.180.

EUR/USD regains some poise and manages to trim part of the weekly pullback following Tuesday’s slump in the wake of the release of US inflation figures.

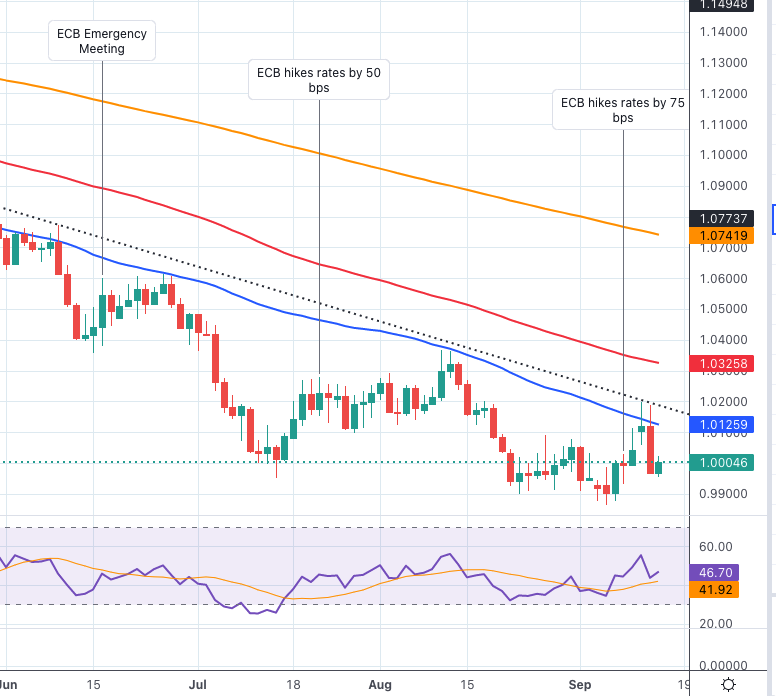
If the recovery picks up extra pace, then the interim hurdle comes at the 55-day SMA at 1.0125 prior to the key 7-month resistance line, today near 1.0180. A move beyond the latter is needed to mitigate the downside pressure and allow at the same time a visit to the interim 100-day SMA at 1.0325 prior to the more relevant August high at 1.0368 (August 10).

In the longer run, the pair’s bearish view is expected to prevail as long as it trades below the 200-day SMA at 1.0741.

EUR/USD daily chart

EUR/USD

Overview
Today last price1.0006
Today Daily Change68
Today Daily Change %0.32
Today daily open0.9974
 
Trends
Daily SMA201.0003
Daily SMA501.0108
Daily SMA1001.0334
Daily SMA2001.075
 
Levels
Previous Daily High1.0187
Previous Daily Low0.9967
Previous Weekly High1.0114
Previous Weekly Low0.9864
Previous Monthly High1.0369
Previous Monthly Low0.9901
Daily Fibonacci 38.2%1.0051
Daily Fibonacci 61.8%1.0103
Daily Pivot Point S10.9898
Daily Pivot Point S20.9822
Daily Pivot Point S30.9677
Daily Pivot Point R11.0118
Daily Pivot Point R21.0263
Daily Pivot Point R31.0339

Author

Pablo Piovano

Born and bred in Argentina, Pablo has been carrying on with his passion for FX markets and trading since his first college years.

More from Pablo Piovano
Share:

Editor's Picks

EUR/USD stays bid near 1.1560, focus shifts to the ECB

EUR/USD extends its weekly recovery for the third day in a row on Wednesday, navigating in a sidelined fashion around 1.1560 on the back of decent losses in the US Dollar. In the meantime, market participants continue to assess the latest US inflation data while hifting its attention to the ECB event on Thursday.

GBP/USD recedes from tops, hovers around 1.3400

GBP/USD could not sustain the initial bull run and is now slipping back toward the 1.3400 neighbourhood on Wednesday. Cable’s continuation of the ongoing leg higher follows mild selling pressure on the Greenback, despite steady uncertainty on the geopolitical front and elevated US inflation.

Gold bleeding continues as Middle East crisis escalates, Fed hike coming

Gold is accelerating its downward trends and approaches the area of $4,100 per troy ounce on Wednesday, where the 2026 bottom sits so far. The persistent decline in the precious metal almost exclusively follows the swelling opinion that the Fed will keep a cautious stance in H2, a view that was reinforced following earlier US CPI data.

$1,500: Why Ethereum just crashed 20% despite spot markets barely selling
Ethereum (ETH) recently suffered one of its sharpest declines of 2026, dropping more than 20% and briefly testing the $1,500 area. While the sell-off appeared to reflect broader market fears, derivatives and on-chain data suggest a more complex story may be unfolding beneath the surface.
Brutal sell-off: Silver deepens months-long slide, refocusing on $60

Silver has never been known for its calm temperament. The precious metal can spend weeks grinding higher before suddenly giving back months of gains in a matter of days. That volatile reputation has been on full display in recent weeks.

The US economy defies the rules: 100 days into the Oil shock and the recession signal is still missing

More than three months after the start of the Iran war and the resulting disruption to global energy markets, the US economy continues to display remarkable resilience. The conflict has triggered a sharp rise in Oil prices, reignited inflationary pressures and fueled widespread concerns about a potential economic slowdown.