|

EUR/USD Price Analysis: Hovers around the major level of 1.0850 above nine-day EMA

  • EUR/USD could find immediate support at the nine-day EMA at 1.0832.
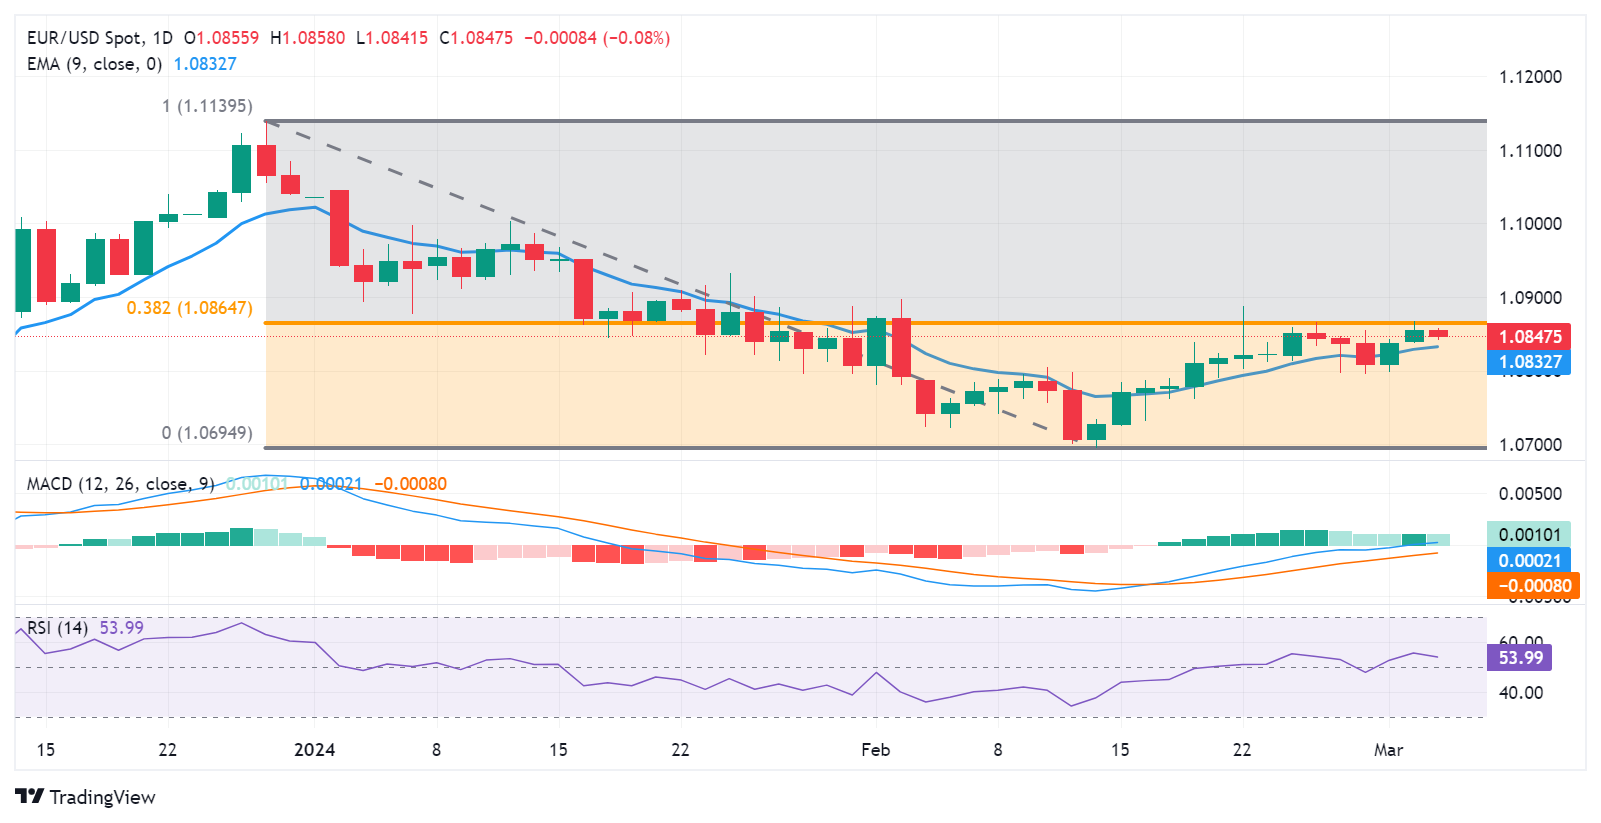
  • The technical analysis suggests a confirmation of bullish momentum for the pair.
  • The 38.2% Fibonacci retracement of 1.0864 appears to be the key resistance level.

EUR/USD recovered some of its intraday losses but remains in negative territory, hovering around 1.0850 during the European session on Tuesday. The US Dollar (USD) strengthened against the Euro (EUR) on the improved sentiment of risk aversion.

The EUR/USD pair could find immediate support around the nine-day Exponential Moving Average (EMA) at 1.0832. A break below this level could put downward pressure on the pair to test the psychological support at 1.0800 aligned with the previous week’s low at 1.0795. Further support appears at the major level of 1.0750 if the pair surpasses the latter.

Technical analysis indicates a bullish sentiment for the EUR/USD pair. The 14-day Relative Strength Index (RSI) is positioned above the 50 mark. Moreover, the Moving Average Convergence Divergence (MACD) exhibits a divergence above the signal line and lies above the centerline. While a lagging indicator, this suggests a confirmation of the bullish momentum for the EUR/USD pair.

On the upside, the immediate resistance levels for the EUR/USD pair are identified at the 38.2% Fibonacci retracement of 1.0864. A break above this level could exert support for the pair to revisit February’s high at 1.0897, in conjunction with the psychological resistance at 1.0900.

EUR/USD: Daily Chart

EUR/USD

Overview
Today last price1.0847
Today Daily Change-0.0009
Today Daily Change %-0.08
Today daily open1.0856
 
Trends
Daily SMA201.0797
Daily SMA501.0868
Daily SMA1001.0828
Daily SMA2001.083
 
Levels
Previous Daily High1.0867
Previous Daily Low1.0838
Previous Weekly High1.0866
Previous Weekly Low1.0796
Previous Monthly High1.0898
Previous Monthly Low1.0695
Daily Fibonacci 38.2%1.0856
Daily Fibonacci 61.8%1.0849
Daily Pivot Point S11.084
Daily Pivot Point S21.0824
Daily Pivot Point S31.0811
Daily Pivot Point R11.0869
Daily Pivot Point R21.0883
Daily Pivot Point R31.0899

Author

Akhtar Faruqui

Akhtar Faruqui is a Forex Analyst based in New Delhi, India. With a keen eye for market trends and a passion for dissecting complex financial dynamics, he is dedicated to delivering accurate and insightful Forex news and analysis.

More from Akhtar Faruqui
Share:

Editor's Picks

AUD/USD eyes 0.7150 barrier nine-day EMA

AUD/USD inches higher after registering modest losses in the previous day, trading around 0.7130 during the Asian hours. The technical analysis of the daily chart indicates that the pair is moving sideways within the rectangle pattern, suggesting a consolidation as neither the bulls nor the bears have enough momentum to take control of the market.

USD/JPY trades below 160.00 intervention threshold; bullish bias intact

The USD/JPY pair attracts some sellers during the Asian session amid fears that authorities will step in again to prop up the Japanese Yen. Furthermore, the Israel-Lebanon truce prompts some profit-taking around the US Dollar and exerts downward pressure on the currency pair.

Gold rebounds from one-week low as Israel-Lebanon truce pressures safe-haven USD

Gold gains some positive traction on Thursday and climbs to the $4,475 area during the Asian session, reversing a major part of the previous day's slide to a one-week low. The Israel-Lebanon truce prompts some profit-taking around the US Dollar and supports the commodity. 


Hyperliquid: ETF demand, capital rotation fuel HYPE rally as Bitcoin melts

Hyperliquid price sustains an upward trend near its all-time high of $75.76 on Thursday after posting 80% gains in May, while Bitcoin (BTC) retraces below $65,000, triggering a market-wide panic.

Kevin Warsh takes the Fed helm: What it means for the US Dollar
The Federal Reserve moves away from the highly predictable "forward guidance" model of the Jerome Powell era to a new “Kevin Warsh environment”, characterized by less communication, more policy surprises, and an increased focus on the Fed's complex balance sheet.
Recession on paper: What really moves the Canadian Loonie now?

Statistics Canada handed the headline writers a gift and the analysts a headache. Real GDP shrank 0.1% on an annualized basis in the first quarter, and with the fourth quarter of 2025 revised down to a 1.0% contraction, that is two negative quarters in a row, the textbook definition of a technical recession and Canada's first since the pandemic.