|

EUR/USD Price Analysis: Euro struggles within 1.0940-65 key resistance zone, mid-tier EU/US data eyed

  • EUR/USD bulls run out of steam inside seven-week-old horizontal resistance region.
  • Overbought RSI, market’s consolidation after ECB, Fed moves challenge Euro pair’s further upside.
  • 78.6% Fibonacci retracement acts as additional challenge for buyers; Euro bears remain off the table beyond 1.0820 support confluence.
  • Final prints of Eurozone inflation, US Michigan Consumer Sentiment Index awaited for clear directions.

EUR/USD treads water around mid-1.0900s during a sluggish early Friday morning in Europe. In doing so, the Euro pair struggles to extend the previous day’s run-up, the biggest since early February, while making rounds to a five-week high.

That said, the pair rallied the previous day as the European Central Bank (ECB) marked a hawkish play to beat Wednesday’s Federal Reserve (Fed) announcements. The latest inaction, however, appears to lack clear catalysts amid a light calendar and cautious mood ahead of the final readings of Eurozone inflation data for May, as per the Harmonized Index of Consumer Prices (HICP) details. Additionally important will be the preliminary readings of the Michigan Consumer Sentiment Index (CSI) for June and five-year inflation expectations.

Also read: EUR/USD grinds at five-week top around 1.0950 as Euro bulls seek more clues of ECB vs. Fed play

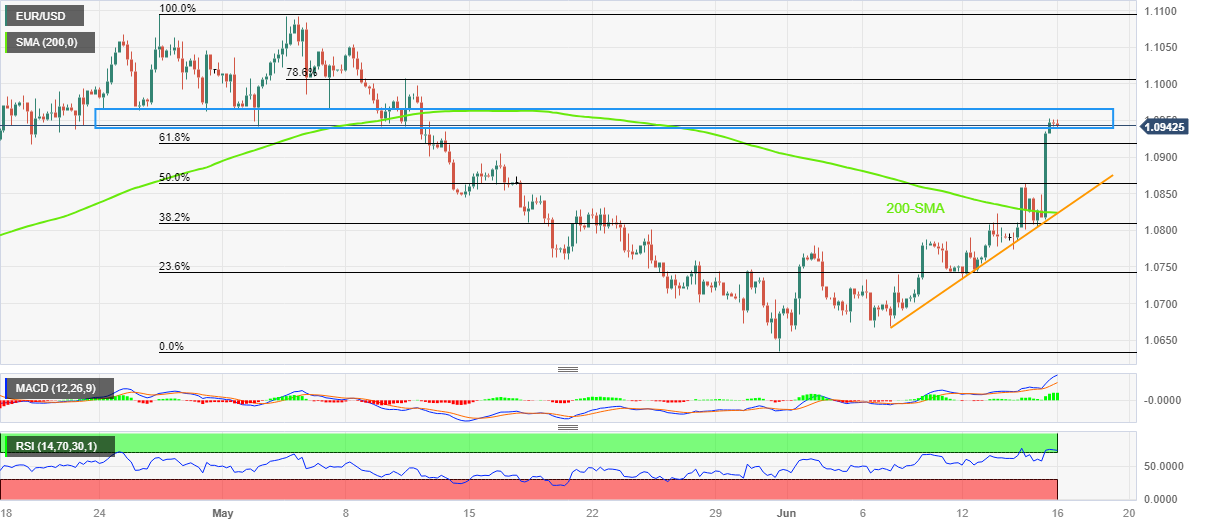
Technically, a horizontal resistance zone comprising multiple levels marked since April 24, between 1.0965 and 1.0940, restricts immediate EUR/USD moves amid the overbought RSI.

Even if the quote manages to cross the 1.0965 hurdle, the 78.6% Fibonacci retracement level of its previous monthly fall, around the 1.1000 psychological magnet, can challenge the EUR/USD bulls ahead of directing them to the yearly high of near 1.1100 marked in April.

On the contrary, a downside break of the 1.0940 immediate support can drag the EUR/USD price to the 61.8% Fibonacci retracement surrounding the 1.0920 level. Following that, the 50% Fibonacci retracement level near 1.0865 may lure the Euro bears.

It should be noted, however, that the EUR/USD buyers should remain hopeful unless witnessing a clear downside break of the 1.0825-20 support confluence including the 200-SMA and an ascending trend line from June 07.

EUR/USD: Four-hour chart

Trend: Pullback expected

Additional important levels

Overview
Today last price1.0943
Today Daily Change-0.0002
Today Daily Change %-0.02%
Today daily open1.0945
 
Trends
Daily SMA201.0757
Daily SMA501.0878
Daily SMA1001.0806
Daily SMA2001.0538
 
Levels
Previous Daily High1.0953
Previous Daily Low1.0804
Previous Weekly High1.0787
Previous Weekly Low1.0667
Previous Monthly High1.1092
Previous Monthly Low1.0635
Daily Fibonacci 38.2%1.0896
Daily Fibonacci 61.8%1.0861
Daily Pivot Point S11.0848
Daily Pivot Point S21.0752
Daily Pivot Point S31.07
Daily Pivot Point R11.0997
Daily Pivot Point R21.1049
Daily Pivot Point R31.1146

Author

Anil Panchal

Anil Panchal

FXStreet

Anil Panchal has nearly 15 years of experience in tracking financial markets. With a keen interest in macroeconomics, Anil aptly tracks global news/updates and stays well-informed about the global financial moves and their implications.

More from Anil Panchal
Share:

Editor's Picks

GBP/USD bounces off lows, back above 1.3200

After bottoming out near 1.3160, GBP/USD manages to regain a bit of shine and reclaim the 1.3200 mark and beyond at the end of the week. Stronger-than-expected UK Retail Sales data seem to be helping the British Pound limit its losses, while the chaotic UK political environment keeps the bulls at bay for now.

EUR/USD looks consolidative around 1.1460

EUR/USD stages a modest rebound after slipping to a three-month low below 1.1420 at the end of the week. That said, the pair now looks to consolidate humble gains just above 1.1460 despite growing uncertainty surrounding the next round of US-Iran negotiations, which keeps the US Dollar’s downside contained.

Gold slips back to six-day lows, targets $4,100

Gold retreats for the third consecutive day on Friday, eroding gains seen in the first half of the week and approaching the key $4,100 mark per troy ounce. Indeed, the precious metal continues to face headwinds from the Fed's hawkish stance and renewed uncertainty surrounding the next round of US-Iran negotiations.

Breaking: Iran closes the Strait of Hormuz amid ceasefire deal violation
Iran says it is closing the Strait of Hormuz after accusing the United States (US) and Israel of violating the ceasefire. According to Iran, the decision came over the continued Israeli strikes in Lebanon. The Iranian Revolutionary Guard Corps Navy issued a warning to all vessels: "Do not approach the Strait of Hormuz; otherwise, your security will be jeopardized."
The Iran war didn't break the US economy, but what happens next?

Nearly four months after the start of the Iran war, the US economy remains remarkably resilient. While the conflict initially triggered a severe disruption to global energy markets and a sharp rise in Oil prices, recent diplomatic progress between Washington and Tehran has eased concerns about a prolonged supply shock.

Regime change: Inside Kevin Warsh's first move to make the Fed unreadable on purpose

The rate did not move. That was the least interesting thing about Kevin Warsh's first meeting in charge of the Fed. The FOMC held its benchmark at 3.50%-3.75% for the fourth straight meeting, exactly as priced, and then the new chair used his first press conference to dismantle the machinery the market has leaned on for a decade.