|

EUR/USD Price Analysis: Euro pressuring 4-day’s lows, approaching 1.0900 handle

  • EUR/USD is easing down from last week’s highs.
  • Bears are pressuring the 1.0920 support level. 
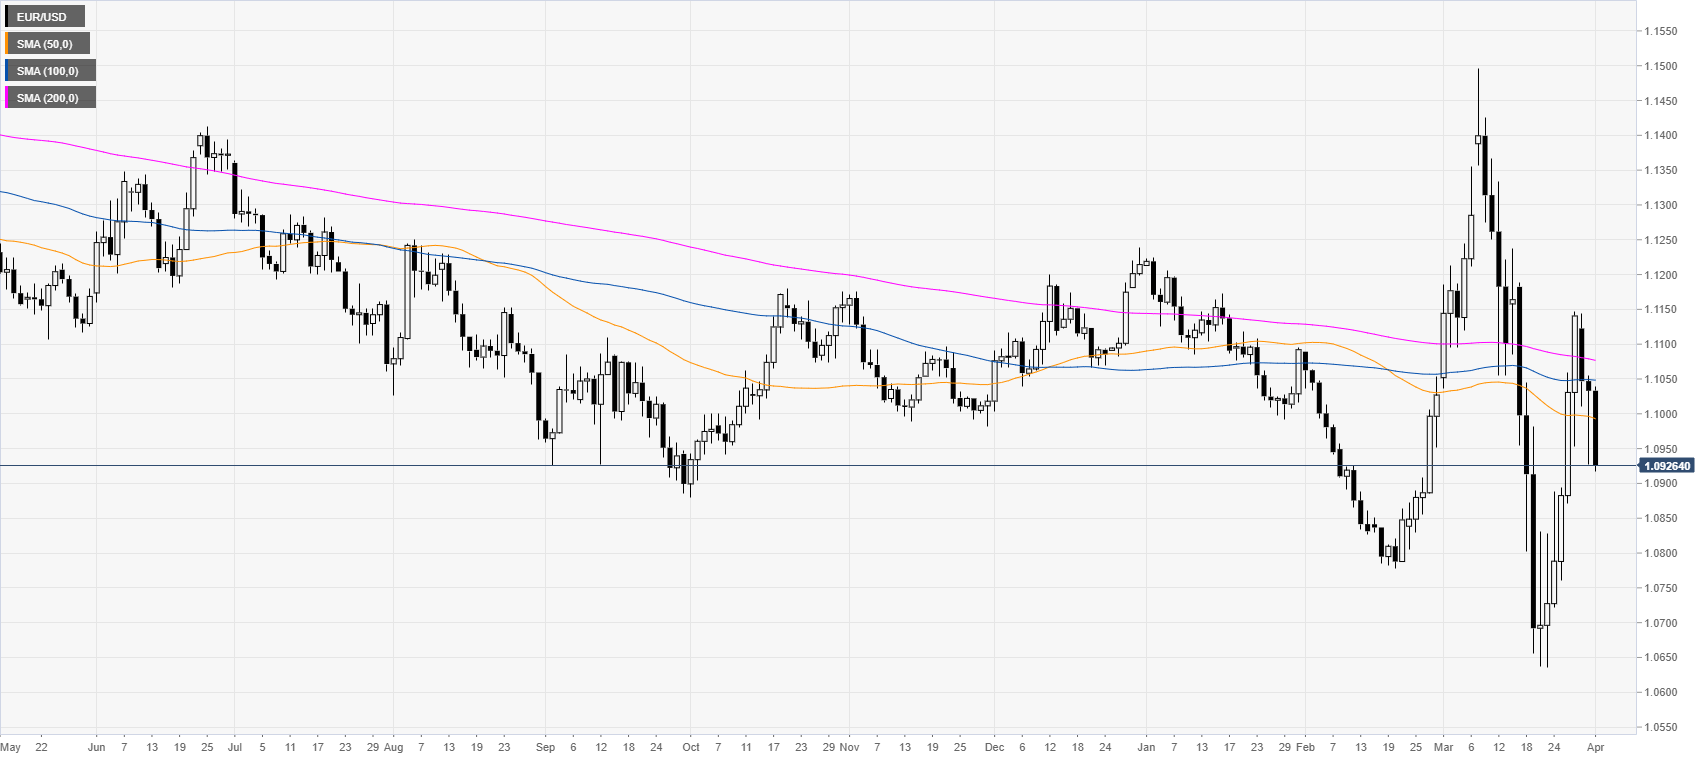
 

EUR/USD daily chart 

 
EUR/USD is pulling back down from last week’s highs as the spot is trading below the 1.1000 figure and the main DMA (daily simple moving average) while DXY is picking up steam.
 

EUR/USD four-hour chart

 
EUR/USD is sliding down while challenging 1.0920 and the 50 SMA on the four-hour chart. Bears would need a clear break below the above-mentioned level to yield further declines towards the 1.0882 and 1.0836 price levels, according to the Technical Confluences Indicator. On the flip side, resistance can emerge near the 1.0984, 1.1007 and 1.1030 levels. 
 
 
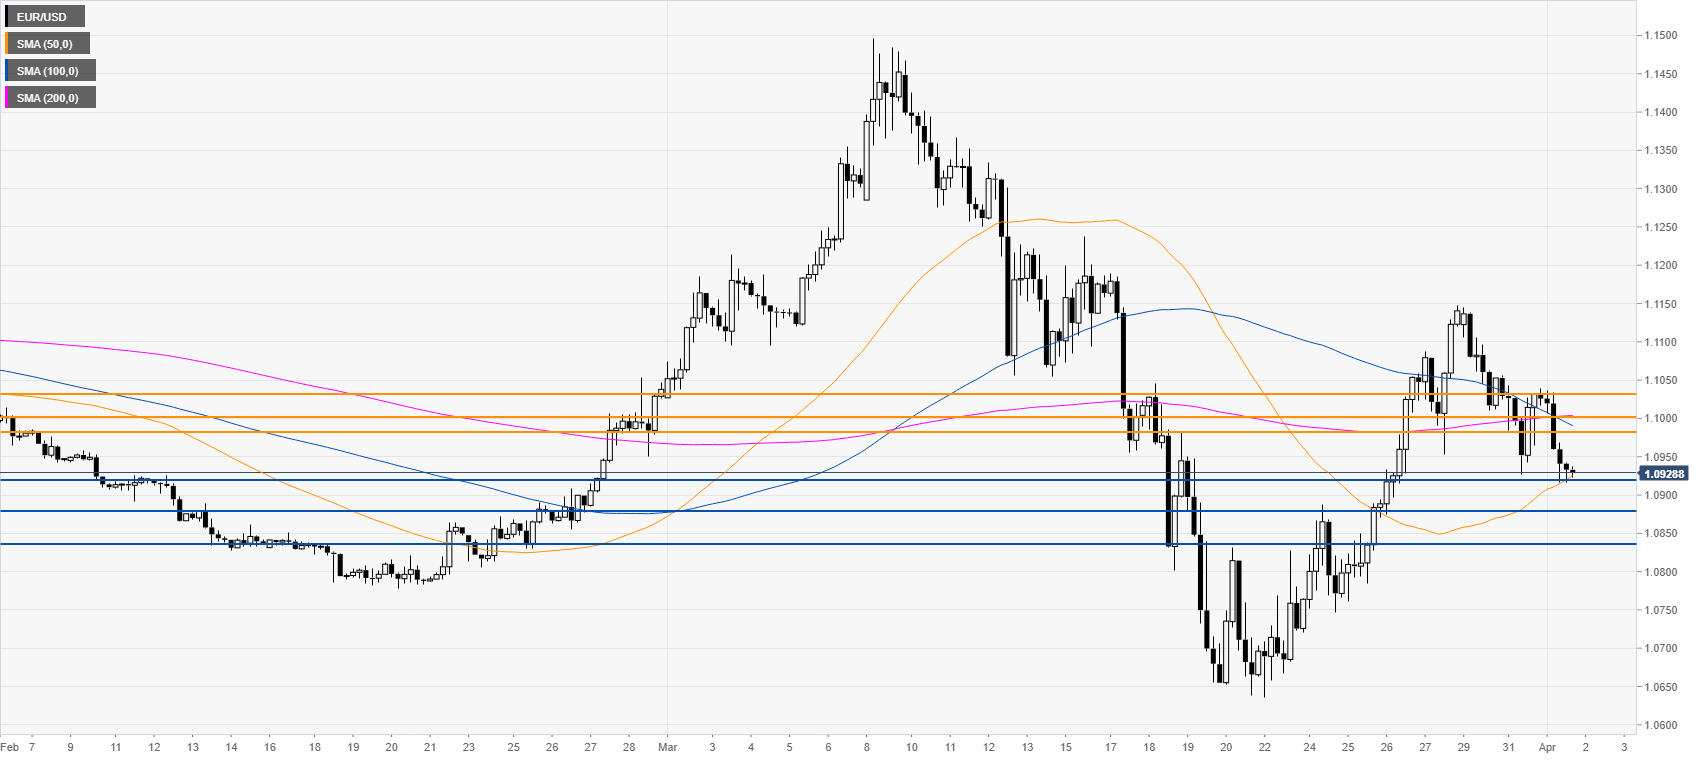
Resistance: 1.0984, 1.1007, 1.1030, 
Support: 1.0920, 1.0882, 1.0836, 


Additional key levels

EUR/USD

Overview
Today last price1.0926
Today Daily Change-0.0107
Today Daily Change %-0.97
Today daily open1.1033
 
Trends
Daily SMA201.1055
Daily SMA501.0998
Daily SMA1001.105
Daily SMA2001.1079
 
Levels
Previous Daily High1.1055
Previous Daily Low1.0927
Previous Weekly High1.1147
Previous Weekly Low1.0636
Previous Monthly High1.1497
Previous Monthly Low1.0636
Daily Fibonacci 38.2%1.0976
Daily Fibonacci 61.8%1.1006
Daily Pivot Point S11.0955
Daily Pivot Point S21.0877
Daily Pivot Point S31.0827
Daily Pivot Point R11.1083
Daily Pivot Point R21.1133
Daily Pivot Point R31.1211

Author

Flavio Tosti

Flavio Tosti

Independent Analyst


More from Flavio Tosti
Share:

Editor's Picks

EUR/USD loses ground below 1.1850 ahead of FOMC Minutes

The EUR/USD pair loses traction near 1.1840 during the early European session on Wednesday, pressured by renewed US Dollar demand. Traders brace for the Federal Open Market Committee Minutes for signals on future rate cuts, which will be released later on Wednesday. 

When is the UK CPI data and how could it affect GBP/USD?

The United Kingdom Consumer Price Index data for January is scheduled to be published today at 07:00 GMT. GBP/USD trades slightly lower at around 1.3556 as of writing. The 20-period Exponential Moving Average trends lower at 1.3593 and continues to cap rebounds. Price holds beneath this gauge, maintaining a short-term bearish bias.

Gold: Is the $5,000 level back in sight?

Gold snaps a two-day downtrend, as recovery gathers traction toward $5,000 on Wednesday. The US Dollar recovers from the overnight sell-off as rebalancing trades resume ahead of Fed Minutes. The 38.2% Fib support holds on the daily chart for now. What does that mean for Gold?

Pi Network rally defies market pressure ahead of its first anniversary

Pi Network is trading above $0.1900 at press time on Wednesday, extending the weekly gains by nearly 8% so far. The steady recovery is supported by a short-term pause in mainnet migration, which reduces pressure on the PI token supply for Centralized Exchanges. The technical outlook focuses on the $0.1919 resistance as bullish momentum increases.

UK jobs market weakens, bolstering rate cut hopes

In the UK, the latest jobs report made for difficult reading. Nonetheless, this represents yet another reminder for the Bank of England that they need to act swiftly given the collapse in inflation expected over the coming months. 

Top 3 Price Prediction: Bitcoin, Ethereum, and Ripple face downside risk as bears regain control

Bitcoin, Ethereum, and Ripple remain under pressure on Wednesday, with the broader trend still sideways. BTC is edging below $68,000, nearing the lower consolidating boundary, while ETH and XRP also declined slightly, approaching their key supports.