EUR/USD Price Analysis: Decline below 61.8% Fibo at around 1.0000 secures a contra bet
- Downside momentum loss on the broader picture still favors the domination of Eurozone bulls.
- The asset has slipped below the 61.8% Fibo retracement at 0.9994.
- Auction below 20-EMA adds to the downside filters.

The EUR/USD pair has dropped to near Wednesday’s low around 0.9969 in the Asian session. The asset has picked offers after a downside break of the consolidation formed in a narrow range of 0.9980-0.9984.
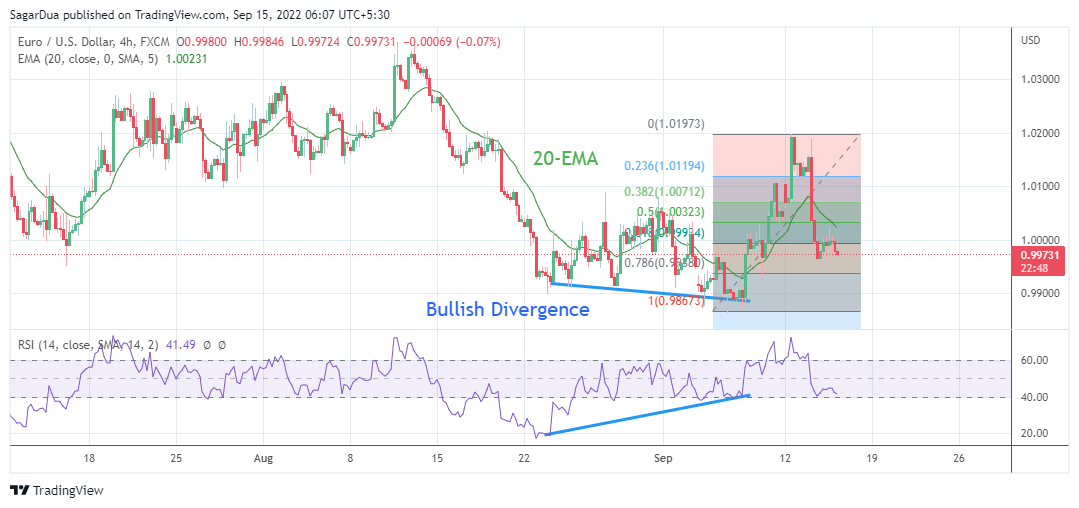
On a four-hour scale, the asset witnessed a strong rebound after displaying downside momentum loss at around September 6 low of 0.9864. The momentum oscillator, Relative Strength Index (RSI) (14) made a higher low while the asset displayed a lower low.
A recovery in the asset was followed by a sheer retracement, which has dragged the asset below 61.8% Fibo area. The marking of the retracement tool from September 6 low at 0.9864 to Monday’s high at 1.0198 displayed the placement of 61.8% Fibo retracement at 0.9994.
The asset has dropped below the 20-period Exponential Moving Average (EMA) at 1.0022, which adds to the downside filters.
Investors should be aware of the fact that retracement has been observed after a Bullish Divergence. A few times retracement gets more steeped due to sour market sentiment. However, the smart money structure is indicating a buy signal above the 20-EMA, which will send the pair towards a 38.2% retracement at 1.0070, followed by Monday’s high at 1.0198.
On the flip side, a break below Wednesday’s low at 0.9955 will drag the asset towards the round-level support of 0.9900, followed by a 19-year low at 0.9864.
EUR/USD four-hour chart
Author

Sagar Dua
FXStreet
Sagar Dua is associated with the financial markets from his college days. Along with pursuing post-graduation in Commerce in 2014, he started his markets training with chart analysis.


