|

EUR/USD Price Analysis: Corrective downside could extend to 1.2040

  • EUR/USD remains offered and trades in 3-day lows.
  • Further south comes in the 100-day SMA near 1.2040.

EUR/USD accelerates the sell-off to the 1.2070 region on Wednesday.

If the selling impetus picks up further pace, then the pair could attempt to re-visit the 1.2040 zone, where is located the 100-day SMA. There is, however, a minor contention area around 1.2060, where coincide the 20-day SMA and a Fibo level (of the November-January rally).

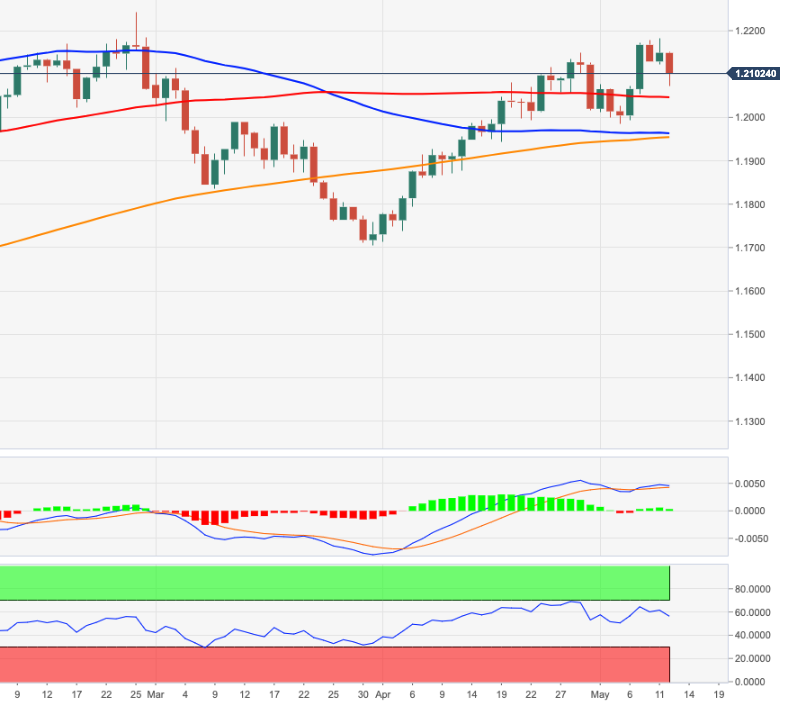
The constructive stance on EUR/USD is forecast to remain intact as long as it trades above the 200-day SMA, today at 1.1949.

EUR/USD daily chart

EUR/USD

Overview
Today last price1.2094
Today Daily Change81
Today Daily Change %-0.45
Today daily open1.2149
 
Trends
Daily SMA201.206
Daily SMA501.1951
Daily SMA1001.2047
Daily SMA2001.1954
 
Levels
Previous Daily High1.2182
Previous Daily Low1.2123
Previous Weekly High1.2172
Previous Weekly Low1.1986
Previous Monthly High1.215
Previous Monthly Low1.1713
Daily Fibonacci 38.2%1.2159
Daily Fibonacci 61.8%1.2145
Daily Pivot Point S11.2121
Daily Pivot Point S21.2093
Daily Pivot Point S31.2062
Daily Pivot Point R11.2179
Daily Pivot Point R21.221
Daily Pivot Point R31.2238

Author

Pablo Piovano

Born and bred in Argentina, Pablo has been carrying on with his passion for FX markets and trading since his first college years.

More from Pablo Piovano
Share:

Editor's Picks

EUR/USD tests nine-day EMA support near 1.1850

EUR/USD inches lower during the Asian hours on Monday, trading around 1.1870 at the time of writing. The 14-day Relative Strength Index momentum indicator at 56 stays above the midline, confirming improving momentum. RSI has cooled from prior overbought readings but stabilizes above 50, suggesting dips could stay limited before buyers reassert control.

GBP/USD flat lines as traders await key UK macro data and FOMC minutes

The GBP/USD pair kicks off a new week on a subdued note and oscillates in a narrow range, just below mid-1.3600s, during the Asian session. Moreover, the mixed fundamental backdrop warrants some caution for aggressive traders as the market focus now shifts to this week's important releases from the UK and the US.

Gold buyers hesitate amid holiday-thinned trading

Gold trades volatile, but within range, as US, China holidays-led thin trading exaggerates moves. The US Dollar extends range play into the US GDP week, with markets pricing at least two Fed rate cuts this year. Technically, Gold tests key support at $5,000; daily RSI still remains bullish.

Top Crypto Losers: Dogecoin, Zcash, Bonk – Meme and Privacy coins under pressure

Meme coins such as Dogecoin and Bonk, alongside the privacy coin Zcash (ZEC), are leading the broader market losses over the last 24 hours. DOGE, ZEC, and BONK ended their three consecutive days of recovery with a sudden decline on Sunday, as crucial resistance levels capped the gains. Technically, the altcoins show downside risk, starting the week under pressure.

Global inflation watch: Signs of cooling services inflation

Realized inflation landed close to expectations in January, as negative base effects weighed on the annual rates. Remaining sticky inflation is largely explained by services, while tariff-driven goods inflation remains limited even in the US.

Ripple Price Forecast: XRP potential bottom could be in sight

Ripple edges up above the intraday low of $1.35 at the time of writing on Friday amid mixed price actions across the crypto market. The remittance token failed to hold support at $1.40 the previous day, reflecting risk-off sentiment amid a decline in retail and institutional sentiment.