|

EUR/USD Price Analysis: Breaks above descending trend channel, the next barrier is seen above 1.0880

  • EUR/USD attracts some buyers to 1.0825 amid weaker USD on Wednesday. 
  • The pair resumes its upside as it holds above the key EMA; RSI indicator stands in bullish territory. 
  • The next upside barrier is seen at 1.0885; the first downside target is located at 1.0795.

The EUR/USD pair extends the rally near 1.0825 on Wednesday during the early European trading hours. The uptick of the major pair is bolstered by the upbeat ZEW Economic Sentiment Survey and the softer US Dollar (USD). Investors will closely monitor the Eurozone GDP growth number, which is forecast to grow by 0.3% QoQ in the first quarter of 2024. 

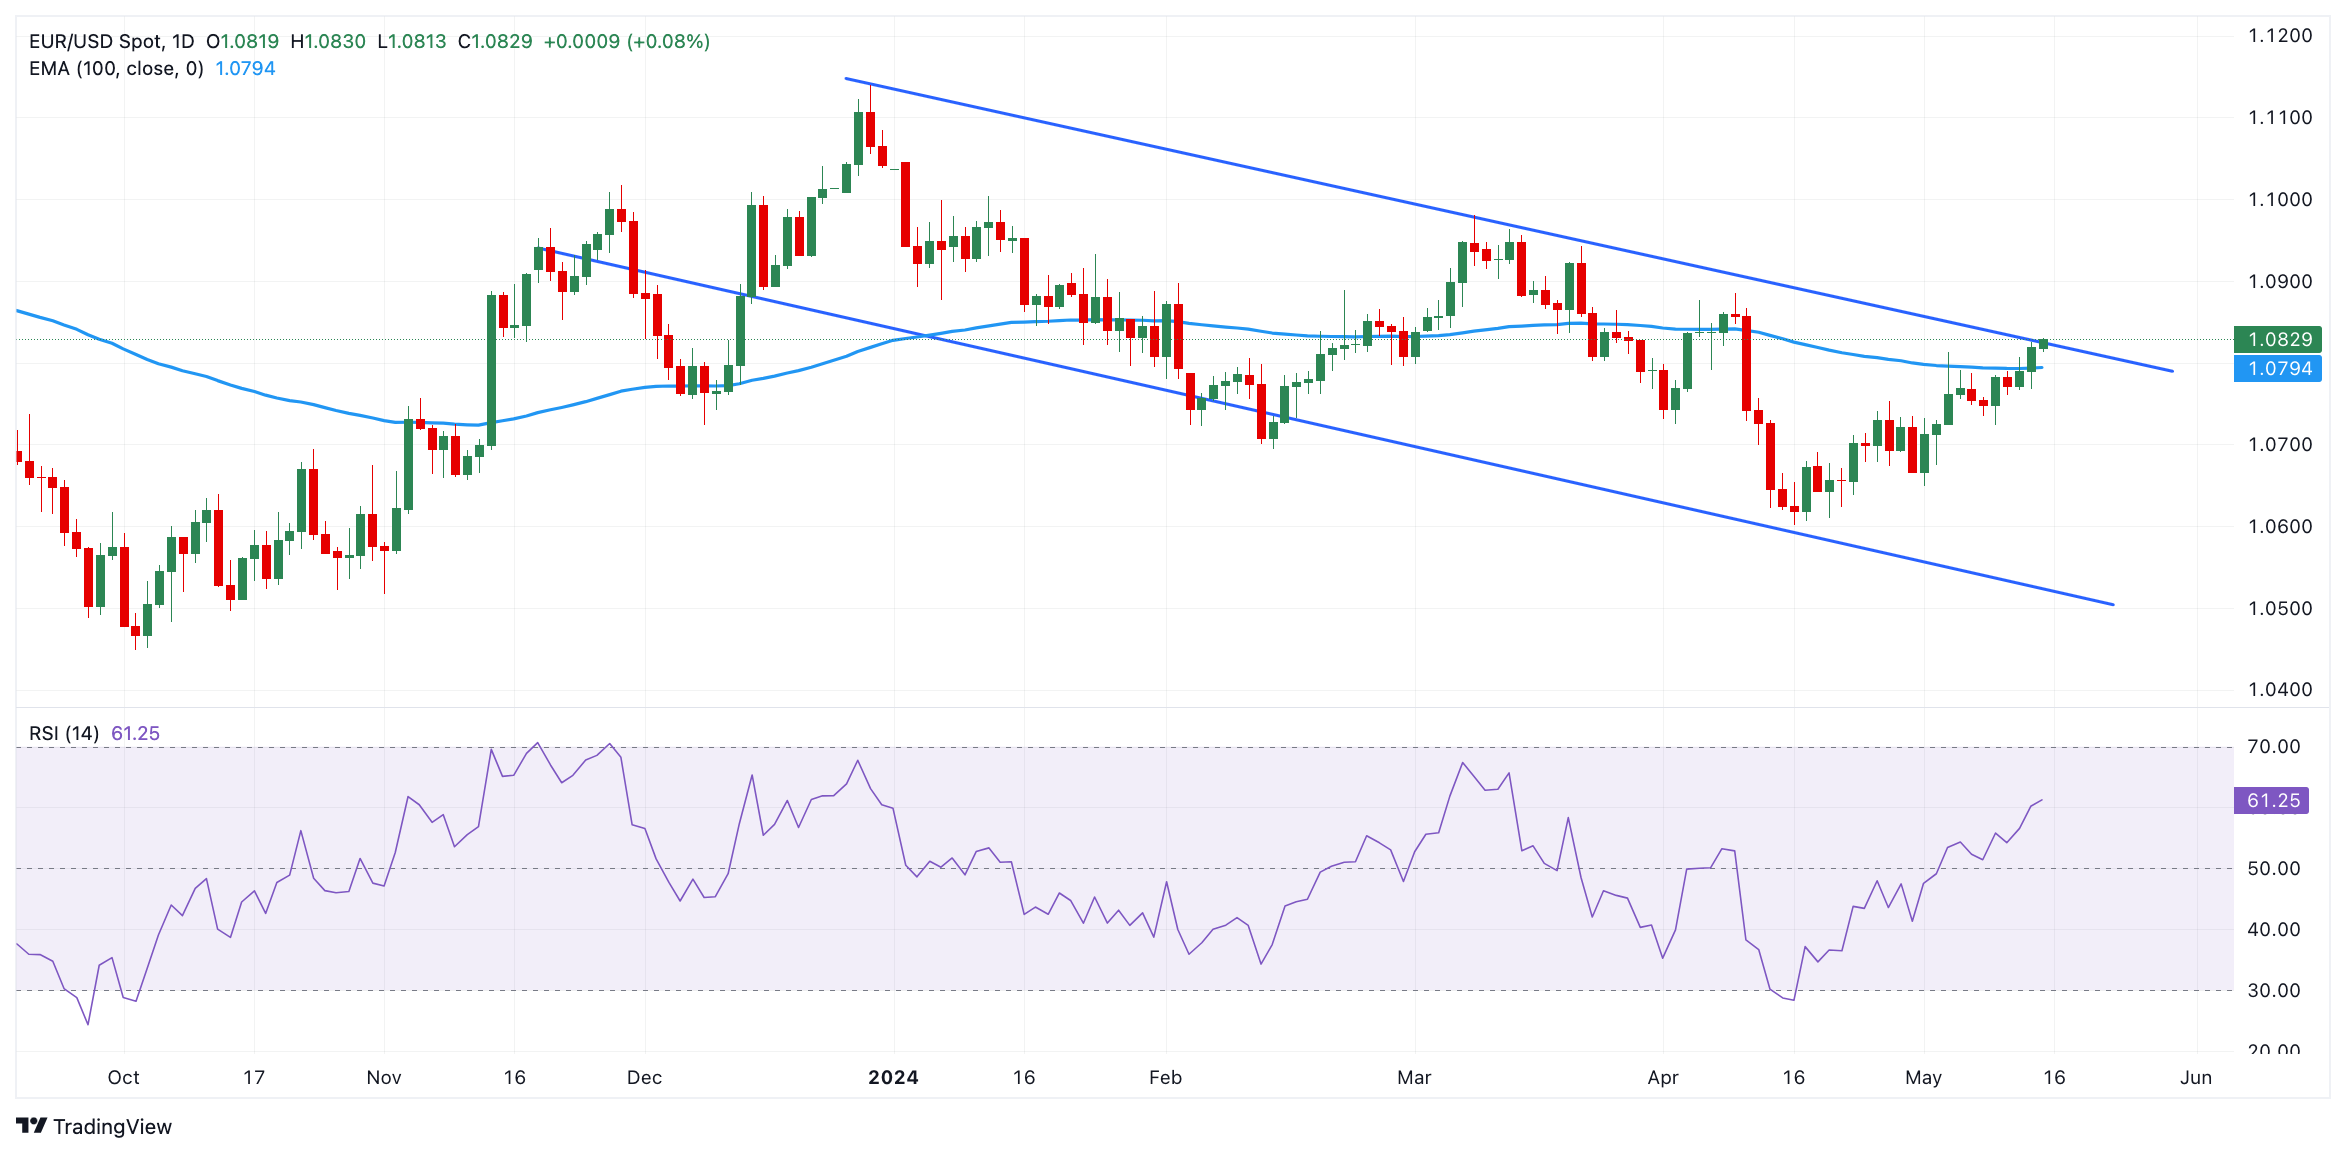
According to the daily chart, EUR/USD has remained confined in a descending trend channel since mid-December 2023. The bullish outlook of the major pair resumes as it crosses above the key 100-day Exponential Moving Average (EMA). Additionally, the upward momentum is bolstered by the 14-day Relative Strength Index (RSI) stands in bullish territory around 60.80, indicating that further upside looks favorable. 

The major pair breaks above the upper boundary of the descending trend channel and the psychological level of 1.0800. The next resistance level is seen at a high of April 9 at 1.0885. The additional upside filter to watch is a high of March 21 at 1.0943, en route to a high of March 8 at 1.0981, and finally the 1.1000 psychological level.  

On the other hand, the first downside target for EUR/USD will emerge near the 100-day EMA at 1.0795. Any follow-through selling below this level will see a drop to a low of May 9 at 1.0724. Further south, the next contention level is located around a low of May 2 at 1.0650, followed by a low of April 16 at 1.0600.  

EUR/USD daily chart

EUR/USD

Overview
Today last price1.0824
Today Daily Change0.0004
Today Daily Change %0.04
Today daily open1.082
 
Trends
Daily SMA201.0724
Daily SMA501.0787
Daily SMA1001.0826
Daily SMA2001.0791
 
Levels
Previous Daily High1.0826
Previous Daily Low1.0767
Previous Weekly High1.0791
Previous Weekly Low1.0724
Previous Monthly High1.0885
Previous Monthly Low1.0601
Daily Fibonacci 38.2%1.0803
Daily Fibonacci 61.8%1.079
Daily Pivot Point S11.0783
Daily Pivot Point S21.0746
Daily Pivot Point S31.0724
Daily Pivot Point R11.0841
Daily Pivot Point R21.0863
Daily Pivot Point R31.0899

Author

Lallalit Srijandorn

Lallalit Srijandorn is a Parisian at heart. She has lived in France since 2019 and now becomes a digital entrepreneur based in Paris and Bangkok.

More from Lallalit Srijandorn
Share:

Markets move fast. We move first.

Orange Juice Newsletter brings you expert driven insights - not headlines. Every day on your inbox.

By subscribing you agree to our Terms and conditions.

Editor's Picks

EUR/USD eyes 1.1800 barrier near two-month highs

EUR/USD extends its gains for the second successive session, trading around 1.1780 during the Asian hours on Tuesday. On the daily chart, technical analysis indicates a persistent bullish bias, as the pair moves upward within the ascending channel pattern. Additionally, the 14-day Relative Strength Index at 68.89 sits near overbought, signaling strong demand. RSI remains elevated, which could cap gains if overbought conditions emerge.

GBP/USD knocks ten-week highs ahead of holiday slowdown

GBP/USD found room on the high side on Monday, kicking off a holiday-shortened trading week with a fresh spat of Greenback weakness, bolstering the Pound Sterling into its highest bids in ten weeks. Pound traders are largely brushing off the latest interest rate cut from the Bank of England as the UK’s central bank policy strategy leaves the water murky for rate-cut watchers.

Gold bulls seem unstoppable amid supportive fundamental backdrop

Gold is seen building on the previous day's strong rally of over 2% and continues scaling new all-time highs for the second consecutive day on Tuesday. The commodity climbs closer to the $4,500 psychological mark during the Asian session and remains well supported by a combination of factors. 

Uniswap holds above $6 as traders eye UNIfication vote outcome

Uniswap price holds above $6 at the time of writing on Tuesday after closing above a key resistance zone in the previous week. Traders are focusing on the highly anticipated UNIfication proposal, which is set to conclude on Thursday, and could become a key near-term catalyst. On the technical side, momentum indicators are flashing bullish signals, hinting at an upside rally.

Ten questions that matter going into 2026

2026 may be less about a neat “base case” and more about a regime shift—the market can reprice what matters most (growth, inflation, fiscal, geopolitics, concentration). The biggest trap is false comfort: the same trades can look defensive… right up until they become crowded.

XRP steadies above $1.90 support as fund inflows and retail demand rise

Ripple (XRP) is stable above support at $1.90 at the time of writing on Monday, after several attempts to break above the $2.00 hurdle failed to materialize last week. Meanwhile, institutional interest in the cross-border remittance token has remained steady.