EUR/USD Price Analysis: Bears stepping in as US yields melt
- EUR/USD is currently trapped between critical support and resistance.
- The single unit is faring better following a fall in US yields.

EUR/USD is slightly firmer on the day trading around the 1.16 figure after rising from a low of 1.1548 to a score a high of 1.1626 following a drop in US yields as follows:
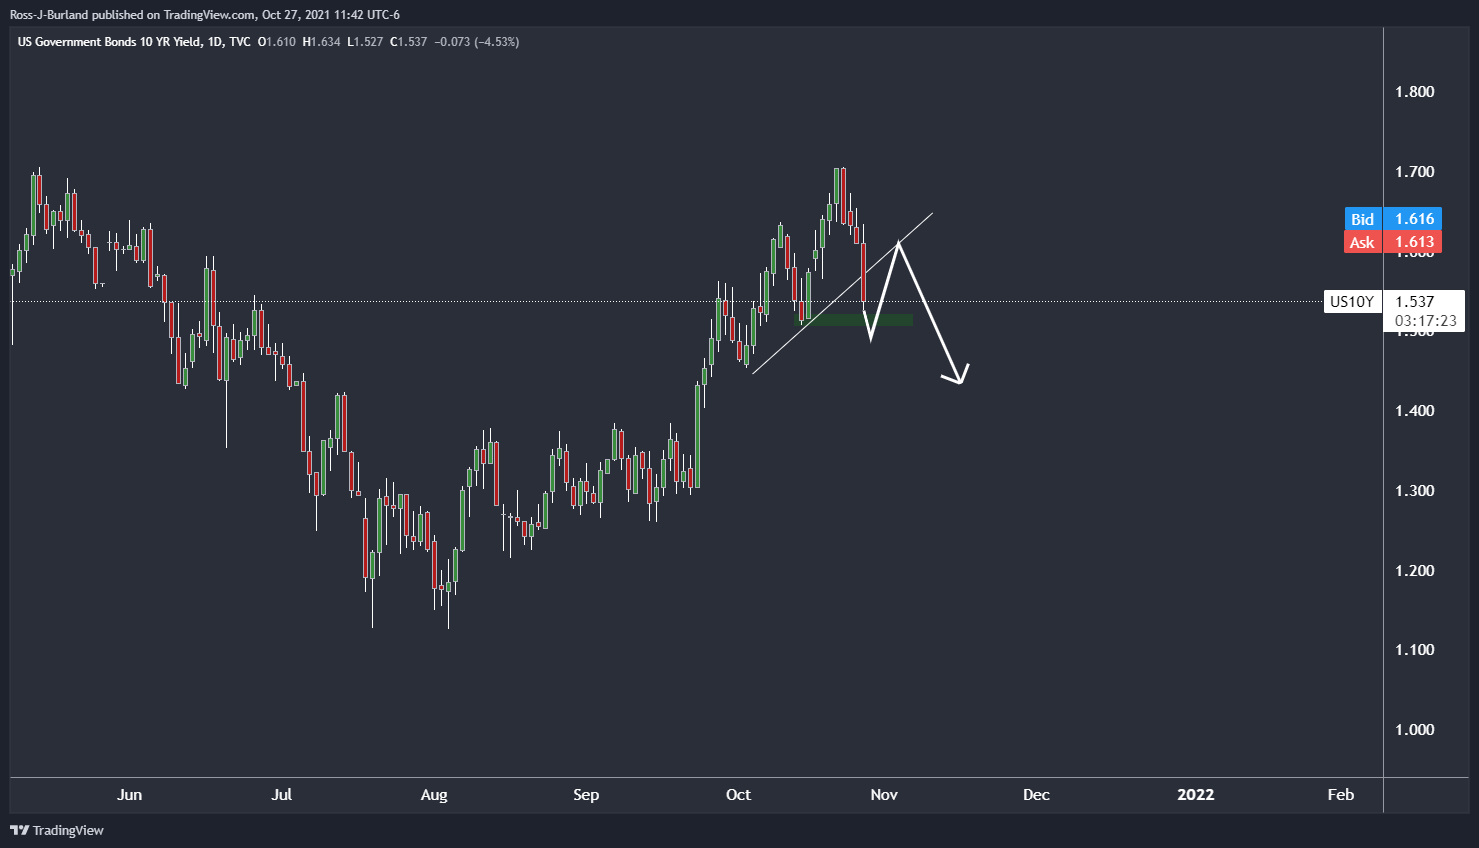
The 10-year yield is testing the horizontal support and has broken below the trendline. On a restest of what is now regarded as a counter trendline, should the bears step in, the US dollar would be expected to be pressured also. This gives rise to bullish prospects for the single currency as follows:
EUR/USD weekly chart
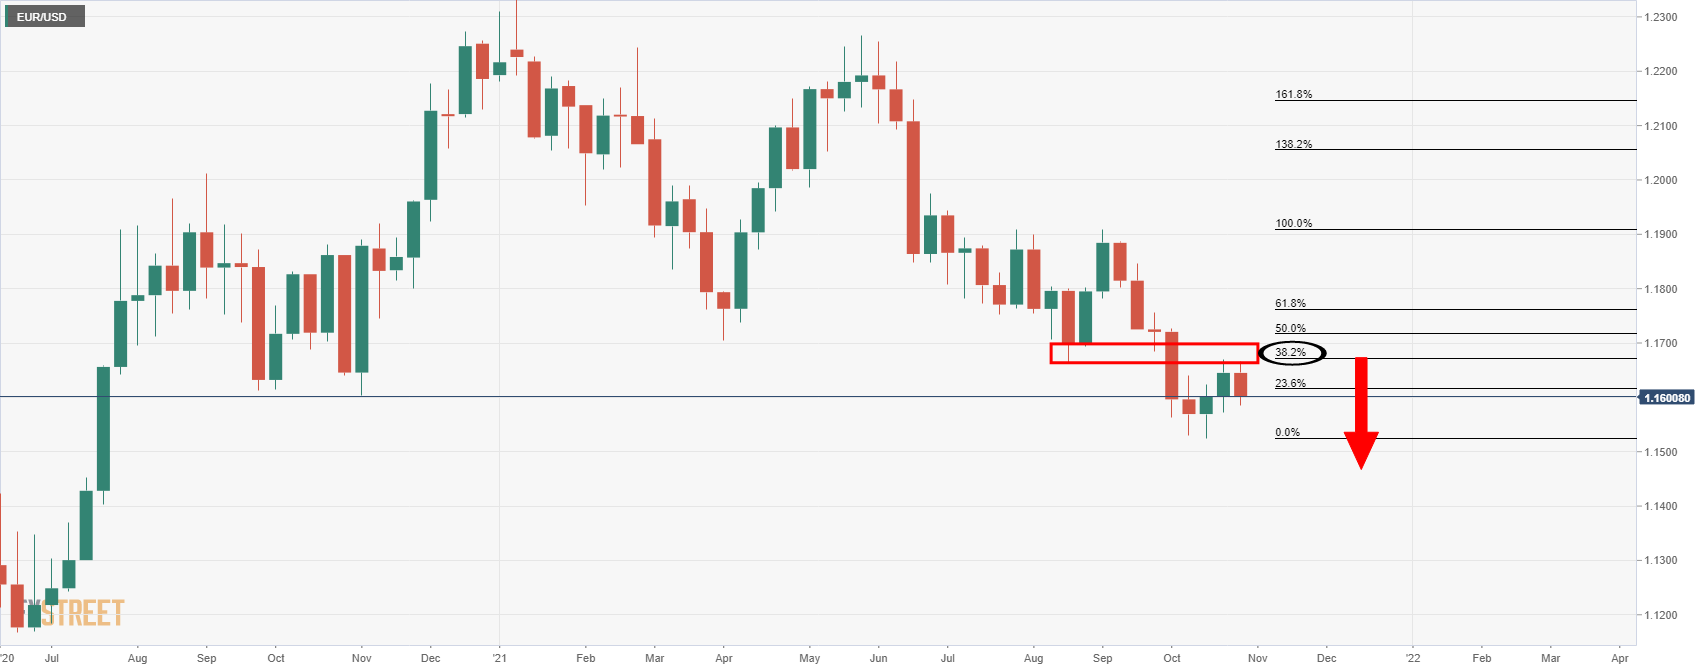
The weekly chart offers a bearish bias at this juncture, pressure below the resistance.
EUR/USD daily chart
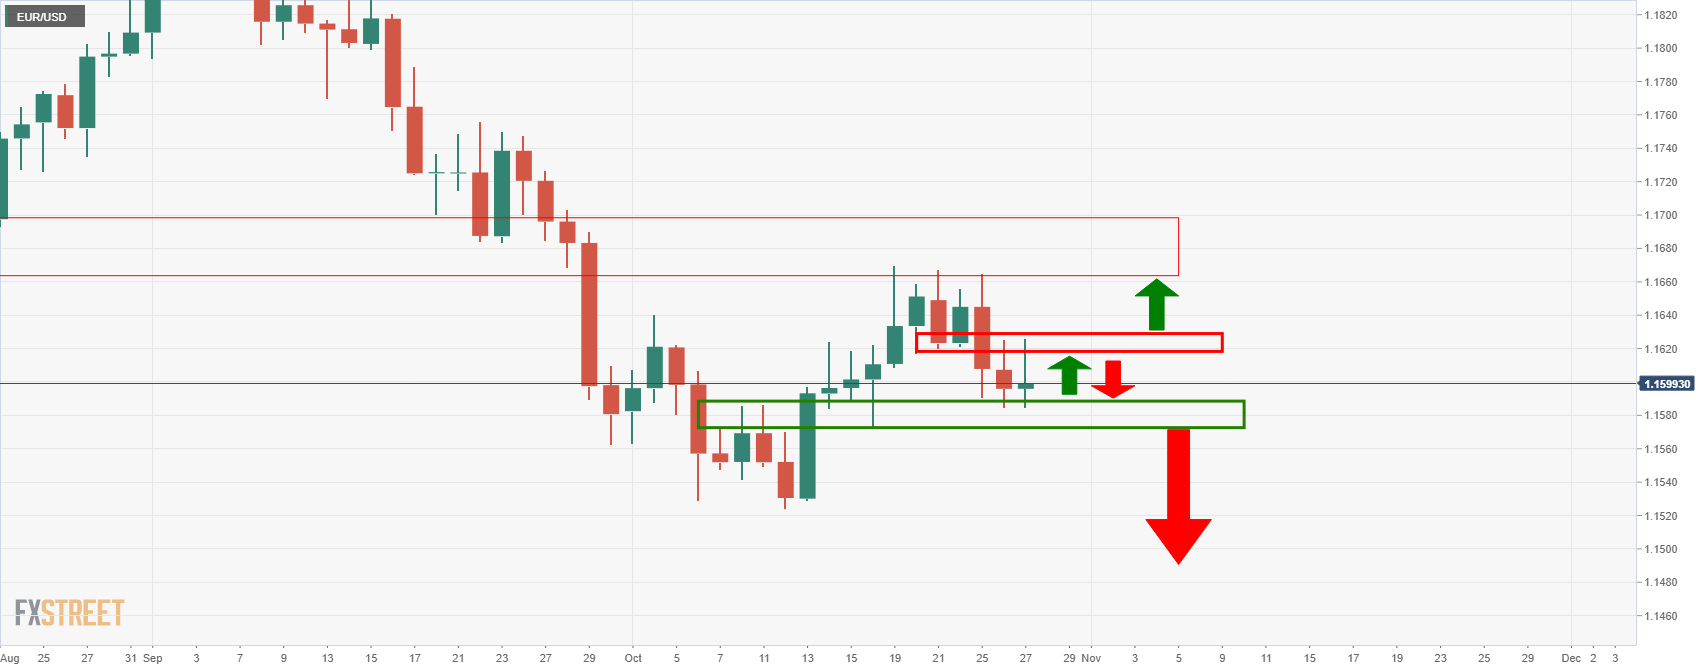
As for the daily chart, the price is trapped between critical support and resistance following a test of the M-formation's neckline.
EUR/USD 4HR chart
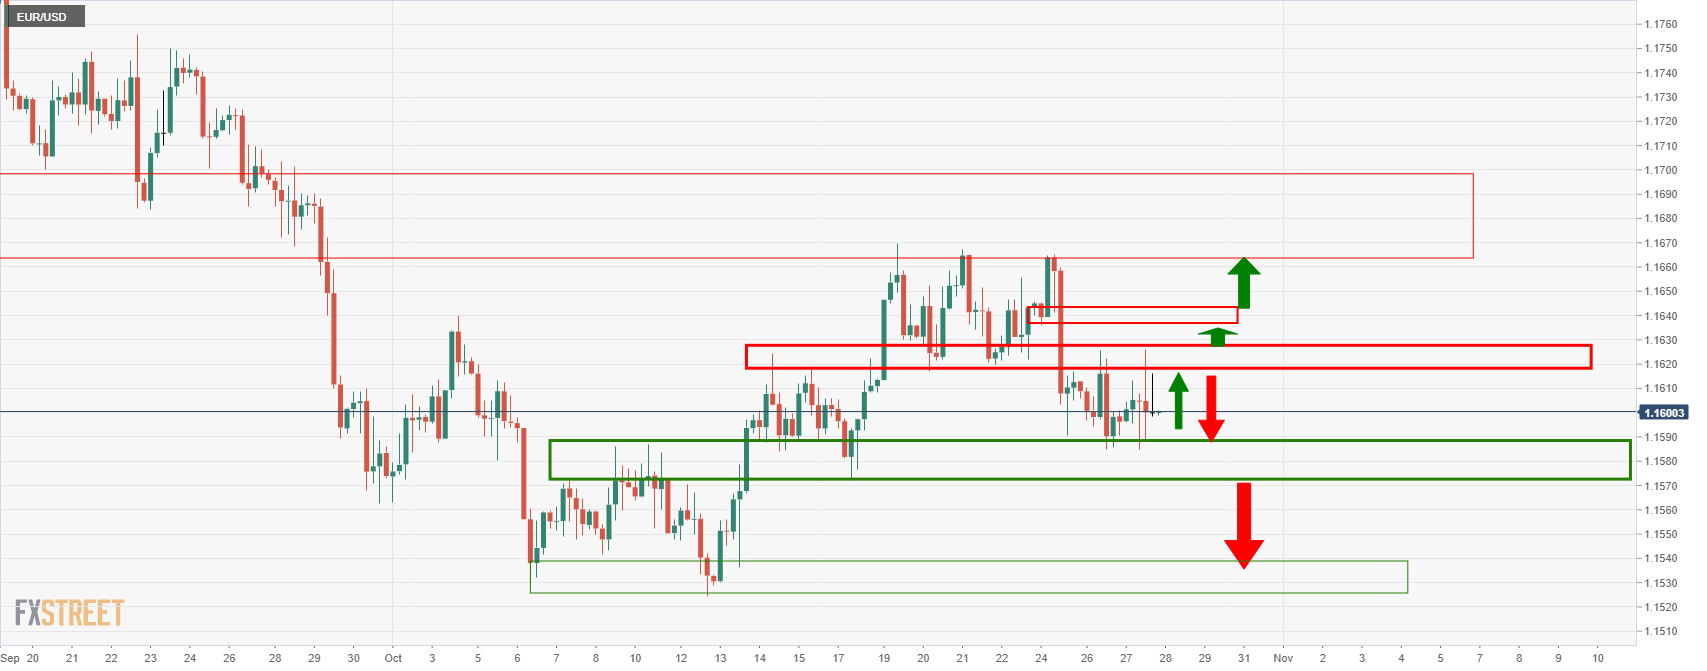
The 4-hour chart illustrates the trapped scenario and the critical levels of support and resistance structure shown in the chart above.
Author

Ross J Burland
FXStreet
Ross J Burland, born in England, UK, is a sportsman at heart. He played Rugby and Judo for his county, Kent and the South East of England Rugby team.


