|

EUR/USD Price Analysis: Bears seeking a break below 1.15 the figure

  • EUR/USD is under pressure on a fractal basis and eyes are on a break below 1.15 the figure. 
  • Day traders will be looking for an optimal entry to scalp the larger move from lower time frames. 

EUR/USD is a compelling bearish scenario and the following technical analysis illustrate the various time frames, from the weekly to the H1 charts.

EUR/USD weekly chart

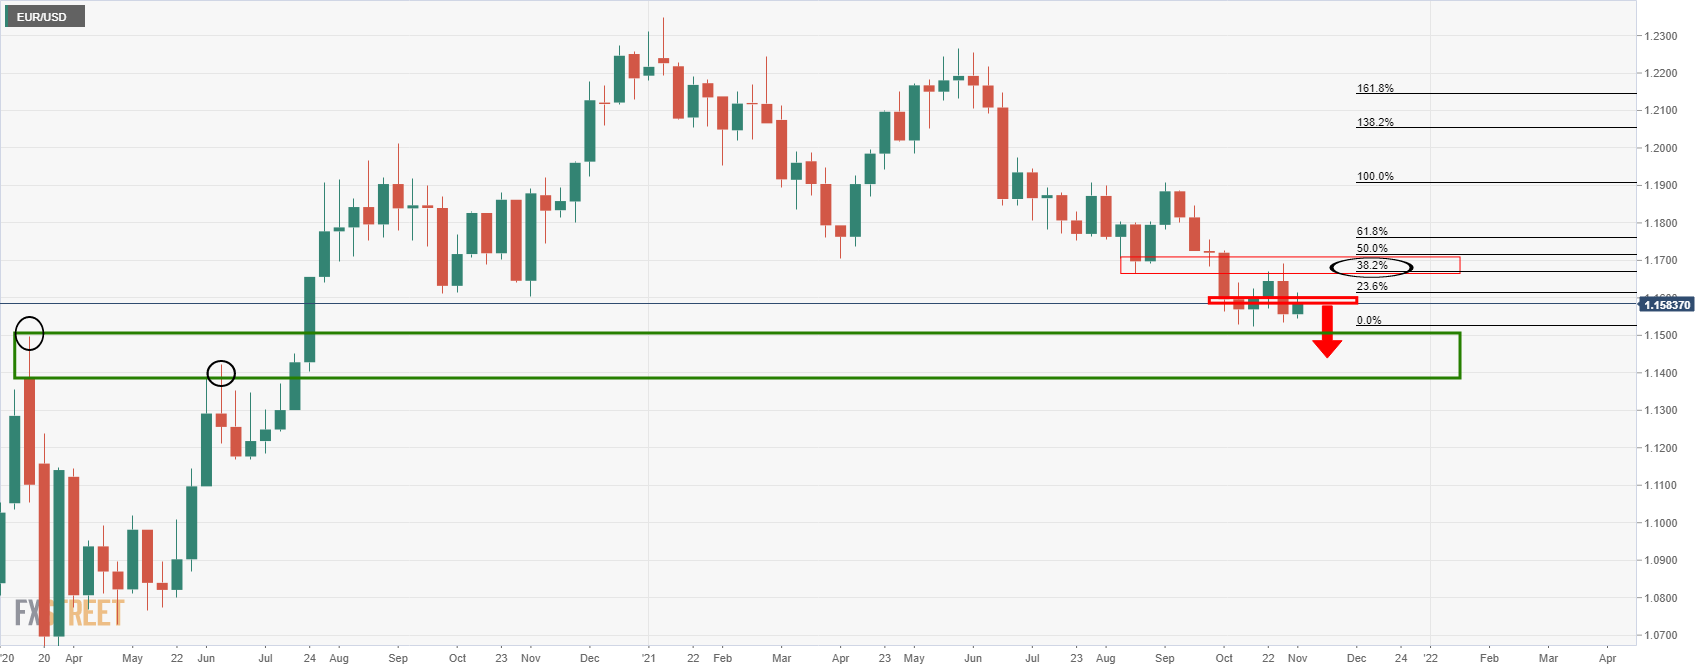
The weekly chart is bearish as the price has already corrected some of the imbalance of price following the weekly bearish impulse. A test into the weekly fractal highs of the spring and summer below 1.15 the figure is in focus. 

EUR/USD daily bearish engulfing candle

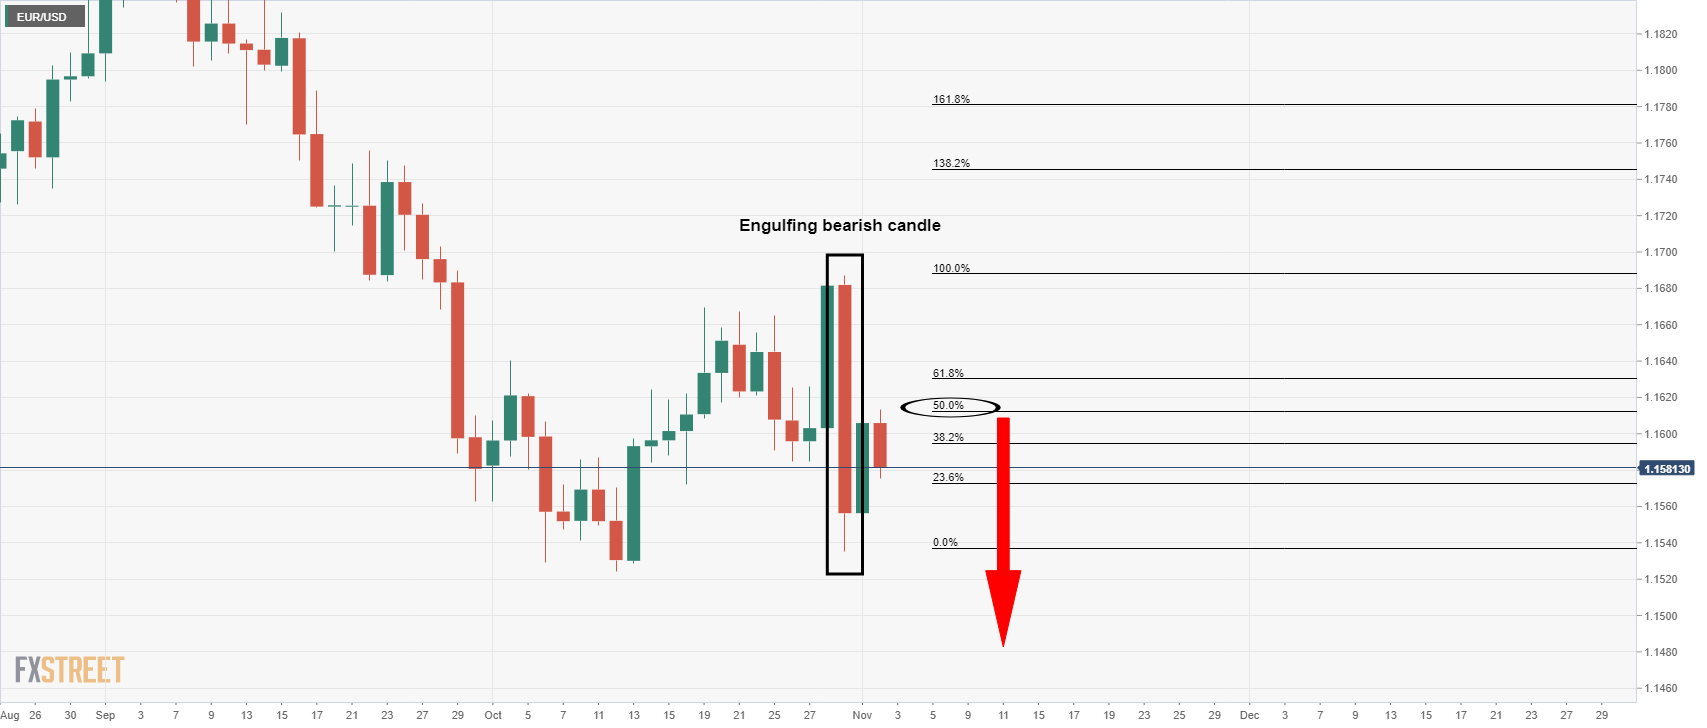
We have seen a strong momentum candle in the last few days which is yet to lead to a lower low. The price has instead corrected 50% of the imbalance in a phase of mitigation and a retest of liquidity. The price has since been rejected which would now be expected to lead to further downside. 

EUR/USD H1 chart

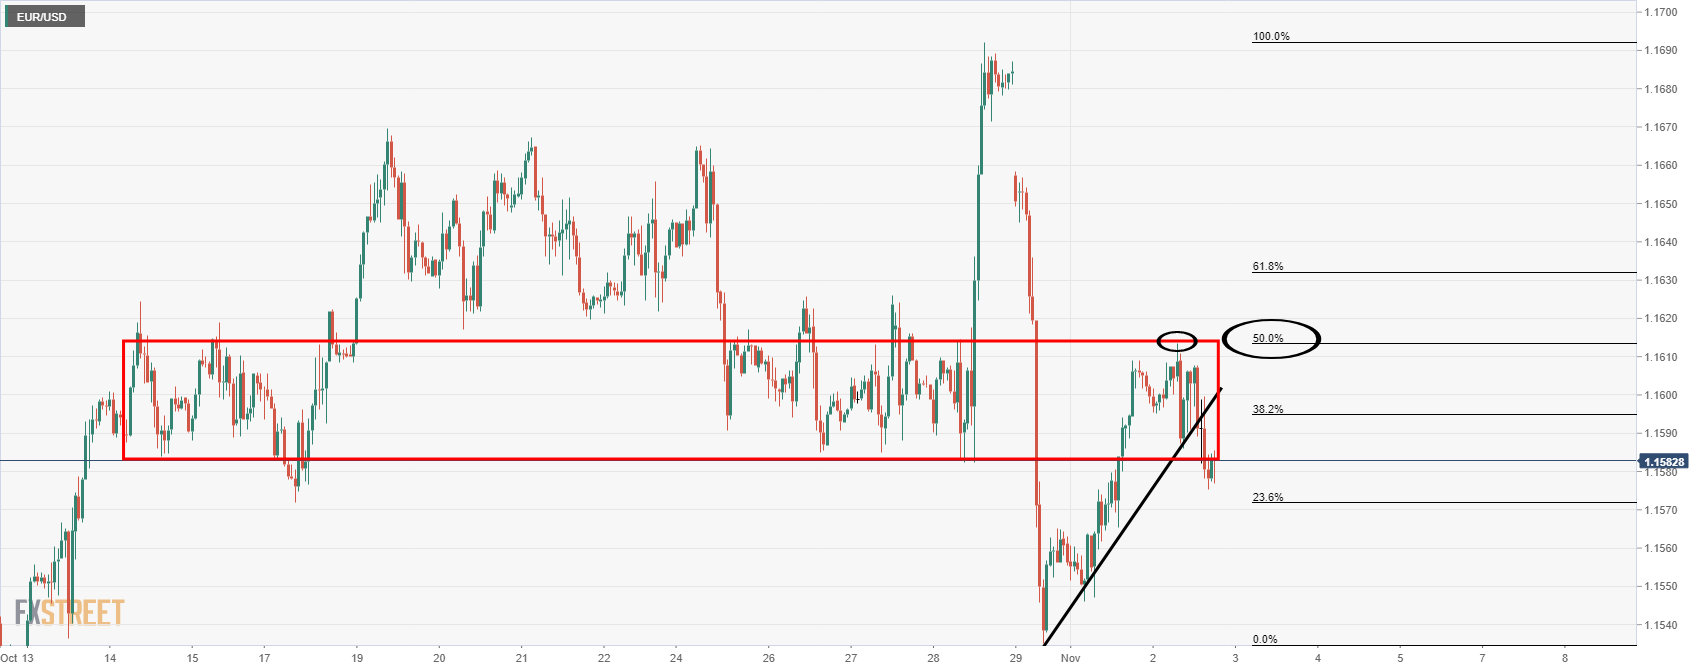
meanwhile, from an intraday trading perspective, the price has corrected a significant portion of the drop and the focus is now back on the downside:

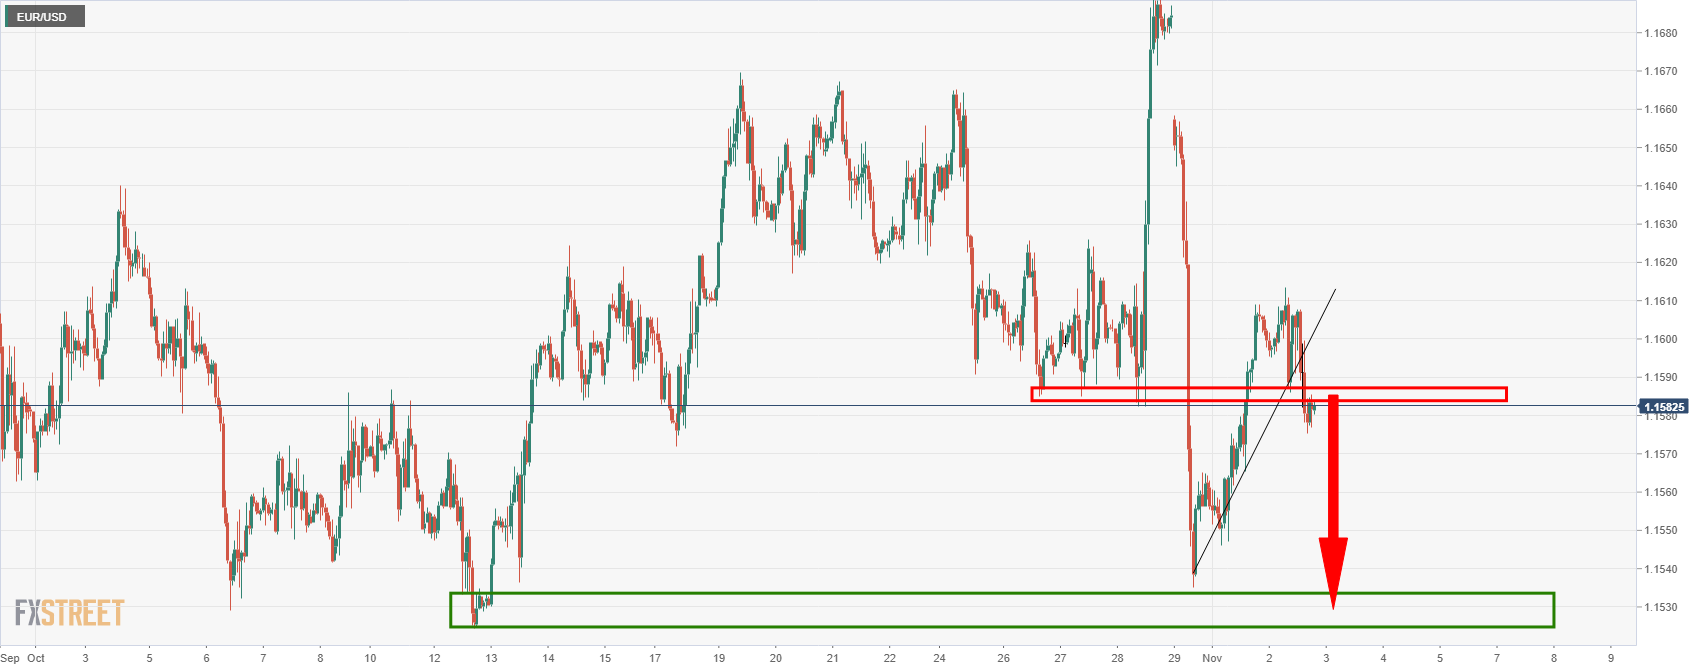
There is now room to go and test the Oct lows in the 1.1520s. 

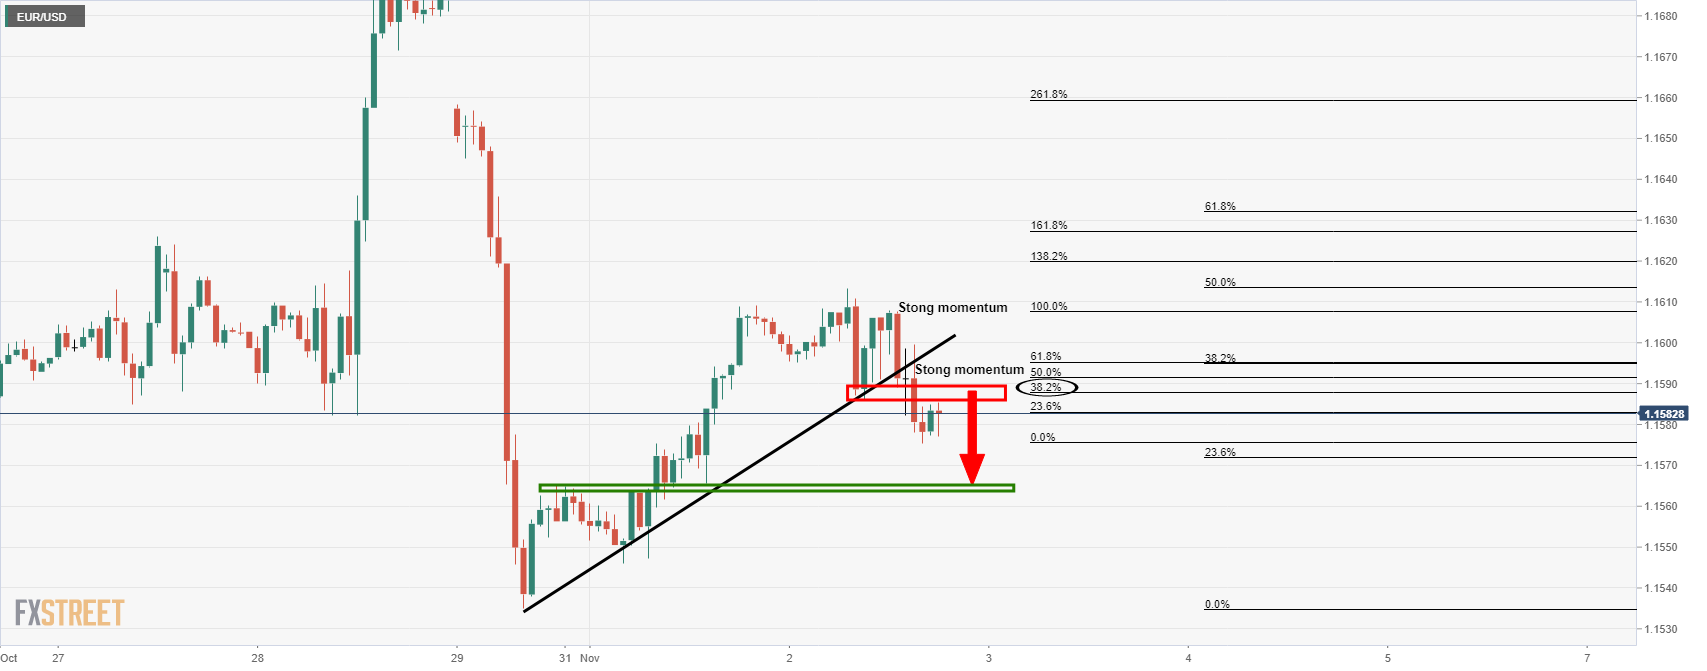
Meanwhile, however, there could be some more correction to go into the 38.2% Fibonacci of the breakout below the trendline that would be expected to act as a counter-trendline on a restest beyond the 38.2%. This would offer a reasonable area for placement of a stop loss to protect short entries in order to target the 1.1560s and beyond. 

Author

Ross J Burland

Ross J Burland, born in England, UK, is a sportsman at heart. He played Rugby and Judo for his county, Kent and the South East of England Rugby team.

More from Ross J Burland
Share:

Editor's Picks

AUD/USD falls to near 0.7100 after slipping below 50-day EMA

AUD/USD depreciates after registering minor gains in the previous day, trading around 0.7120 during the Asian hours. The technical analysis of the daily chart shows the pair consolidating sideways within a rectangle pattern, as neither bulls nor bears gain control. The AUD/USD pair is holding a slight bearish tone however as it sits beneath both the nine-day and 50-day EMAs.

160.00: USD/JPY back near intervention territory after upbeat US jobs report

US Nonfarm Payrolls beat expectations by a wide margin in May, with 172K jobs added. The US Dollar rebounds after the release, helping USD/JPY recover from its intraday lows. Warnings from Japanese authorities continue to limit upside potential near the 160.00 threshold.

Gold targets $4,300 amid stronger Dollar

Gold faces increasing selling interest and navigates the area of three-month lows near the $4,300 mark per troy ounce on Friday. The precious metal’s decline comes as traders assess the stronger-than-expected NFP, while the bid bias in the Greenback and higher US Treasury yields also collaborate with the retracement.

Cardano hits five-year low even as Hoskinson clarifies "break" isn't an exit

Cardano (ADA) price is down 10% at press time on Friday, extending losses over 30% so far this week amid Charles Hoskinson's clarification that "break" isn't an exit.

Week ahead – Fed countdown begins amid US inflation data and geopolitical risks

Fed Chair Warsh’s first meeting approaches as key US inflation data could reshape expectations. Oil prices remain elevated as US-Iran talks continue; tariffs also return to the spotlight. ECB is expected to hike; will it be a one-off move or is July live?

The US economy defies the rules: 100 days into the Oil shock and the recession signal is still missing

More than three months after the start of the Iran war and the resulting disruption to global energy markets, the US economy continues to display remarkable resilience. The conflict has triggered a sharp rise in Oil prices, reignited inflationary pressures and fueled widespread concerns about a potential economic slowdown.