|

EUR/USD Price Analysis: Attention remains on the 2023 peak

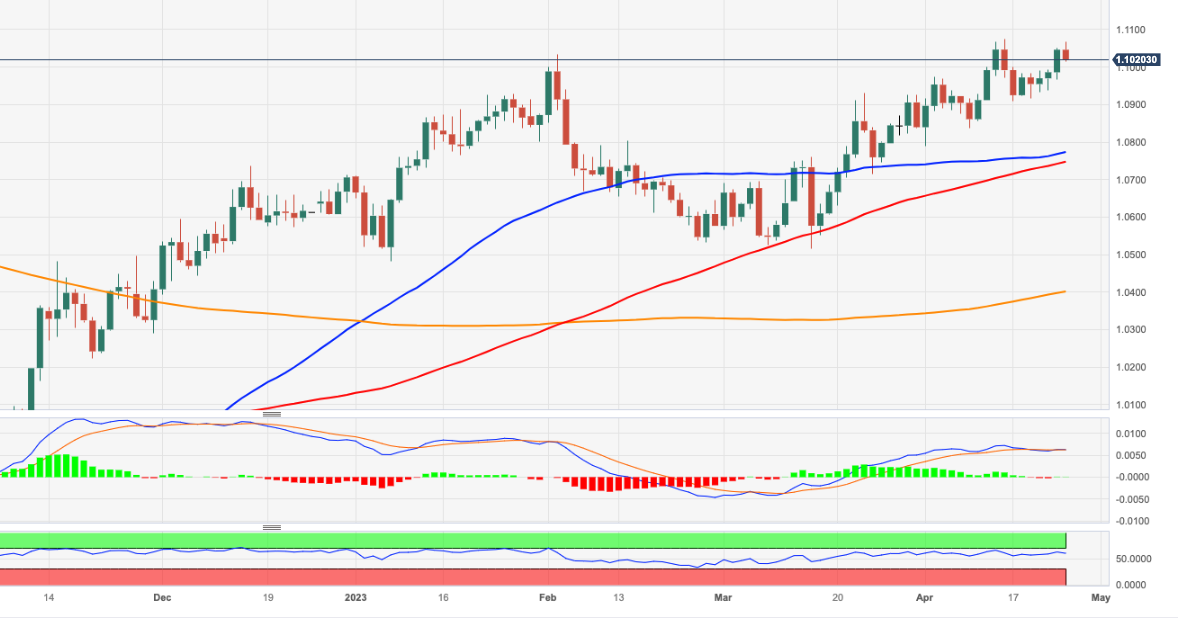
  • EUR/USD comes under some pressure following recent tops.
  • Immediately to the upside emerges the 2023 high at 1.1075.

EUR/USD surrenders part of the recent positive streak following the breakout of the 1.1000 barrier.

The pair looks poised to extend the recovery further in the near term. That said,  the immediate hurdle is expected at the 2023 high at 1.1075 (April 14) seconded by the round level at 1.1100.

Looking at the longer run, the constructive view remains unchanged while above the 200-day SMA, today at 1.0400.

EUR/USD daily chart

EUR/USD

Overview
Today last price1.1021
Today Daily Change52
Today Daily Change %-0.23
Today daily open1.1046
 
Trends
Daily SMA201.0934
Daily SMA501.0774
Daily SMA1001.0742
Daily SMA2001.0398
 
Levels
Previous Daily High1.105
Previous Daily Low1.0966
Previous Weekly High1.1
Previous Weekly Low1.0909
Previous Monthly High1.093
Previous Monthly Low1.0516
Daily Fibonacci 38.2%1.1018
Daily Fibonacci 61.8%1.0998
Daily Pivot Point S11.0991
Daily Pivot Point S21.0937
Daily Pivot Point S31.0907
Daily Pivot Point R11.1076
Daily Pivot Point R21.1105
Daily Pivot Point R31.116

Author

Pablo Piovano

Born and bred in Argentina, Pablo has been carrying on with his passion for FX markets and trading since his first college years.

More from Pablo Piovano
Share:

Editor's Picks

EUR/USD looks apathetic around 1.1770

EUR/USD comes under renewed pressure on Tuesday, deflating below the 1.1800 support and reversing two consecutive days of gains. The pair’s decline follows the persistent move higher in the US Dollar, as trade uncertainty dominates the sentiment ahead of President Trump’s SOTU speech.

GBP/USD regains 1.3500 and above

GBP/USD extends its advance for the third day in a row on Tuesday, this time retesting the area beyond the 1.3500 hurdle. Cable’s uptick comes despite decent gains in the Greenback and the dovish message from the BoE’s Bailey at the UK Parliament.

Gold appears offered around $5,150

Gold is giving back a good portion of the recent multi-day rally, receding to the $5,150 zone per troy ounce amid the decent bounce in the US Dollar and mixed US Treasuty yields. In the meantime, markets’ attention remain on upcoming comments from Fed speakers.

Ripple’s DeFi shift in focus: Navigating XRPL EVM sidechain growth, XRPFi migration and liquidity

Ripple (XRP) has continued to trade under pressure, extending its decline by approximately 63% from the record high of $3.66 in July. The remittance token is trading above support at $1.35, while its upside appears limited by key supply zones, starting with $1.40, at the time of writing on Tuesday.

The Citrini report: How a debatable AI narrative can shake Wall Street

That AI-related headline alone was enough to rattle investors.US stocks slid sharply on Monday after a widely circulated Citrini Research memo outlined a hypothetical “2028 Global Intelligence Crisis”, warning that rapid AI adoption could push US unemployment into double digits as early as by mid-2028.

XRP pressured by weak ETF flows and declining retail interest

Ripple (XRP) is edging lower, trading above its intraday low of $1.32 at the time of writing on Tuesday. The decline from its weekly opening of $1.39 reflects heightened volatility in the broader cryptocurrency market, accentuated by tariff-triggered uncertainty.