EUR/USD paddles near 1.1050 to round out 2023
- EUR/USD is holding steady in thin markets to wrap up the trading year.
- The Euro is set for a 3% gain against the US Dollar for the year.
- US data continues to miss the mark as the economic outlook softens.

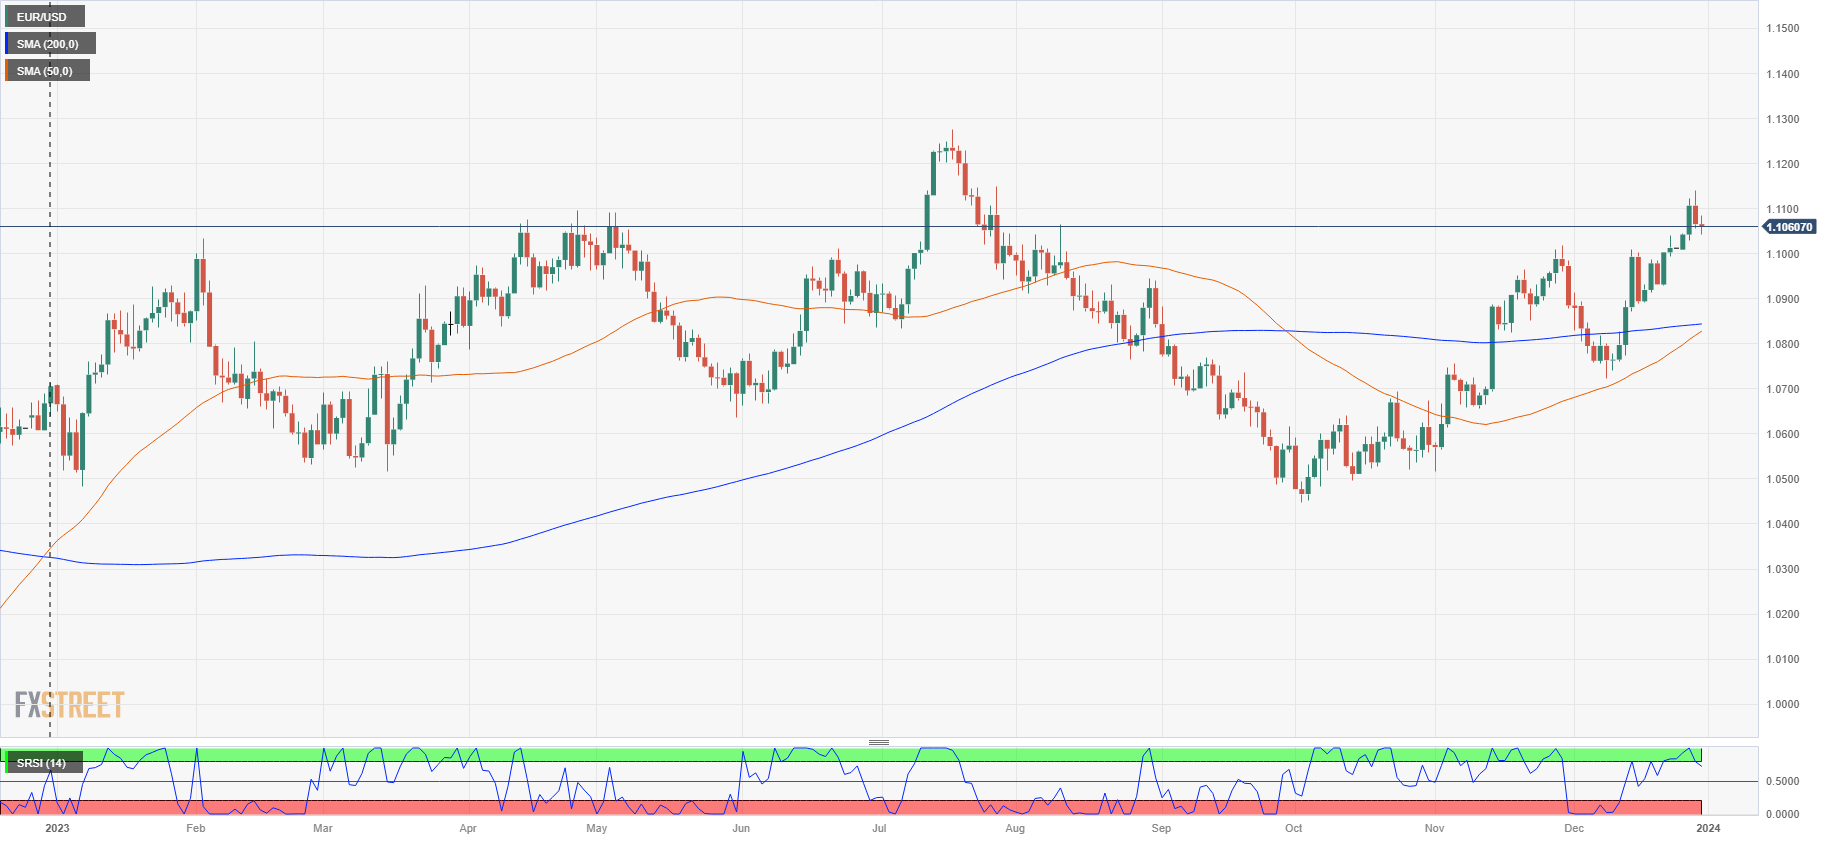
The EUR/USD is trading flat on Friday, the last trading session of 2023. The Euro (EUR) is on pace to close up 3% against the US Dollar (USD) for 2023, rallying 5.8% from the year’s bottom bids near 1.0450 in October. The EUR/USD is still down nearly 2% from 2023’s peak at 1.1275 set in July, but the pair is leaning firmly into the bullish side as broader markets continue to sell off the Greenback in anticipation of rate cuts from the Federal Reserve (Fed) in 2024.
US Dollar to end 2023 on the low side as markets bet big on rate cuts
With meaningful Eurozone economic data absent from the calendar until the HCOB Eurozone Composite Purchasing Managers’ Index (PMI) on January 4, it’s up to the US data docket to do the heavy lifting to round out the trading year.
The US Chicago PMI for December missed the mark on Friday, printing at a contractionary 46.9 versus November’s 18-month peak of 55.8, slipping past the median market forecast of 51.0. Softening economic data from the US continues to counter-intuitively bolster market risk appetite, as a weakening economic outlook increases the odds of an accelerated pace of rate hikes from the Fed in 2024. Investor expectations have run well ahead of the Fed’s own rate outlook for next year, which currently sees up to 75 basis points in rate cuts through the end of 2024; money markets are pricing in upwards of 160 basis points to come off the Fed’s main reference rate by the end of next December.
EUR/USD Technical Outlook
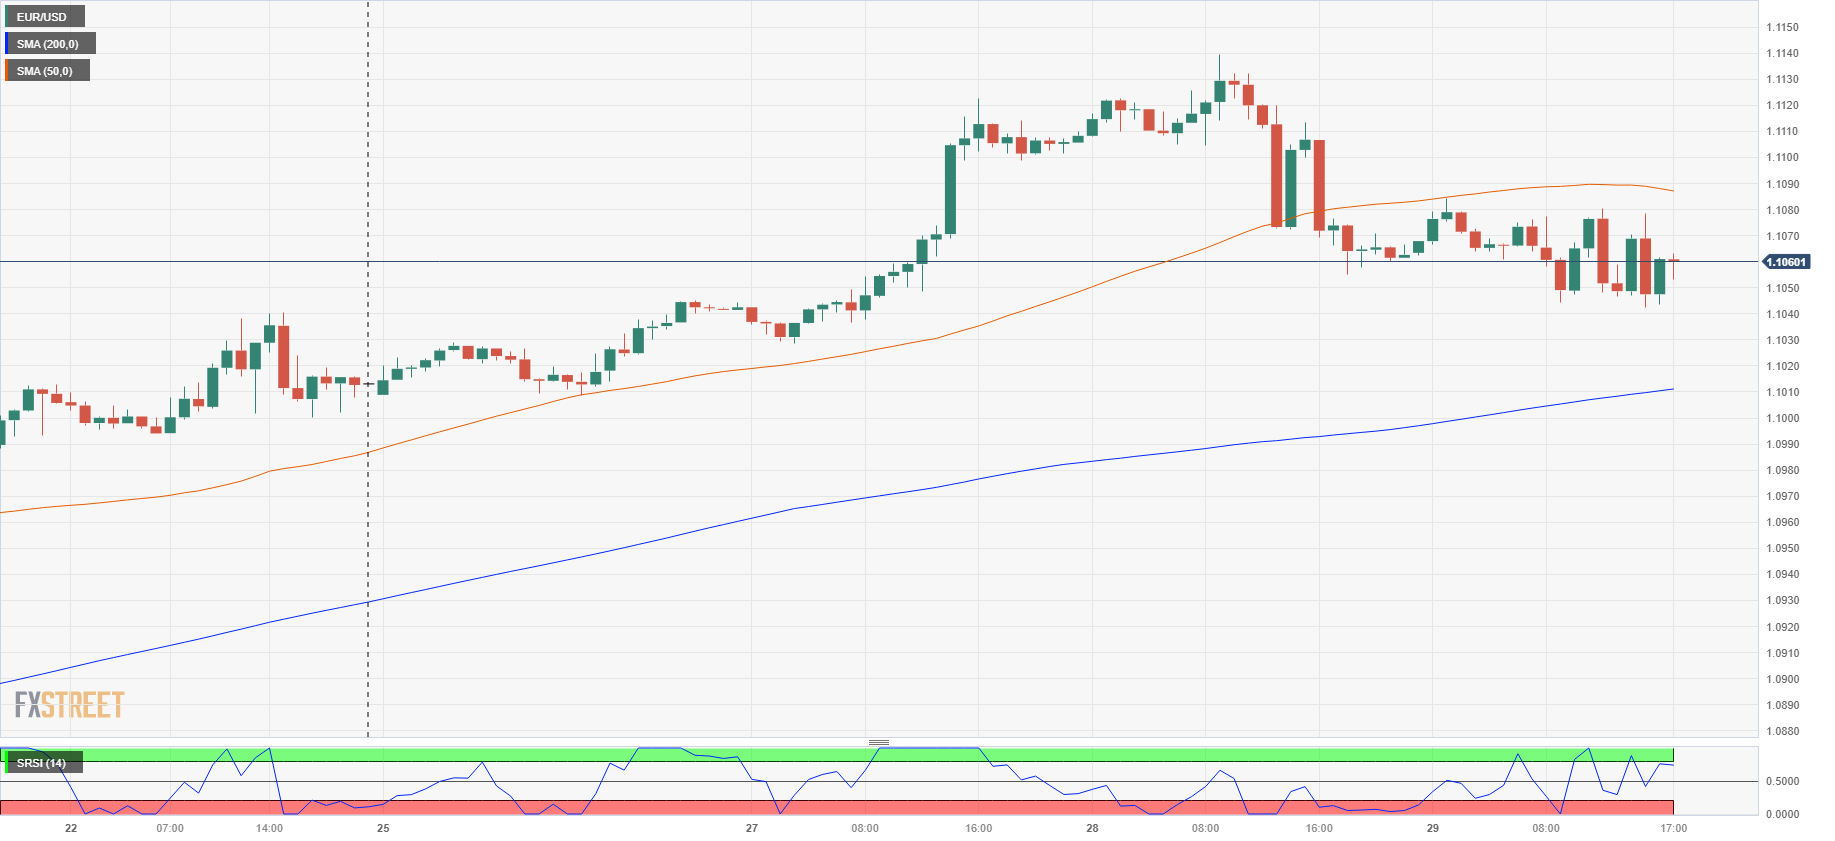
With the EUR/USD stuck in place near 1.1050 on the intraday charts, the Euro is set to drift between the 50-hour and 200-hour Simple Moving Averages (SMAs) as the 2023 trading year rounds the corner into 2024.
A protracted post-holiday trading week will give way to another extended holiday following the New Year’s market closures, and the EUR/USD is set to head into the new year catching technical support from the 200-hour SMA just above the 1.1000 handle.
Daily candlesticks tell a notably overbought story with the Euro pulling back from Thursday’s multi-month highs near 1.1150 and the 50-day SMA accelerating into a bullish cross of the 200-day SMA near 1.0850. Technical indicators are also flashing warning signs of a possible extended pullback with the Relative Strength Index (RSI) flashing a retreat from overbought conditions on a 14-day basis.
EUR/USD Hourly Chart
EUR/USD Daily Chart
EUR/USD Technical Levels
Author

Joshua Gibson
FXStreet
Joshua joins the FXStreet team as an Economics and Finance double major from Vancouver Island University with twelve years' experience as an independent trader focusing on technical analysis.
















