EUR/USD remains firm with US Jobless Claims data on tap
- EUR/USD extends gains beyond 1.1700, amid broad-based US Dollar weakness.
- A dovish Fed monetary policy statement sent the US Dollar tumbling on Wednesday.
- Market concerns about an AI bubble are weighing on risk appetite.

EUR/USD has retraced previous losses and trades near 1.1720 at the time of writing, its highest level in nearly two months, after rallying nearly 0.8% in the last two days. An improving market sentiment has provided additional support to the Euro while the US Dollar remains on its back foot, as the market digests Wednesday's dovishly tilted US Federal Reserve (Fed) monetary policy

Investors have shrugged off the risk-averse sentiment triggered by downbeat sales and revenue forecasts released by the cloud computing giant Oracle on Wednesday, which renewed market concerns about an overvaluation of the AI sector. European equity markets have turned positive after a negative opening, although Wall Street futures are still showing moderate losses.
On Wednesday, the US Dollar, which had tumbled across the board, followed a less hawkish-than-expected monetary policy decision by the Fed on Wednesday. The US central bank cut interest rates by 25 basis points, as expected, but hawkish dissent was weak, and Chairman Jerome Powell showed more relaxed about inflation, which hints at further rate cuts in 2026.
On Thursday, the focus is on the US Initial Jobless Claims data, which will be observed with particular interest to confirm whether the previous week's decline was due to the Thanksgiving holiday or it was a signal of some improvement in the labour market.
Euro Price Today
The table below shows the percentage change of Euro (EUR) against listed major currencies today. Euro was the strongest against the Australian Dollar.
| USD | EUR | GBP | JPY | CAD | AUD | NZD | CHF | |
|---|---|---|---|---|---|---|---|---|
| USD | -0.19% | 0.03% | -0.08% | 0.00% | 0.30% | 0.06% | -0.45% | |
| EUR | 0.19% | 0.22% | 0.11% | 0.19% | 0.51% | 0.26% | -0.26% | |
| GBP | -0.03% | -0.22% | -0.10% | -0.02% | 0.27% | 0.03% | -0.48% | |
| JPY | 0.08% | -0.11% | 0.10% | 0.10% | 0.39% | 0.12% | -0.36% | |
| CAD | -0.01% | -0.19% | 0.02% | -0.10% | 0.31% | 0.03% | -0.45% | |
| AUD | -0.30% | -0.51% | -0.27% | -0.39% | -0.31% | -0.25% | -0.73% | |
| NZD | -0.06% | -0.26% | -0.03% | -0.12% | -0.03% | 0.25% | -0.50% | |
| CHF | 0.45% | 0.26% | 0.48% | 0.36% | 0.45% | 0.73% | 0.50% |
The heat map shows percentage changes of major currencies against each other. The base currency is picked from the left column, while the quote currency is picked from the top row. For example, if you pick the Euro from the left column and move along the horizontal line to the US Dollar, the percentage change displayed in the box will represent EUR (base)/USD (quote).
Daily Digest Market Movers: A dovish Fed is weighing on the US Dollar
- The Federal Reserve cut rates by 25 basis points to the 3.50%-3.75% range on Wednesday, and the dot plot signalled only one further rate cut in 2026. The absence of a more hawkish divergence, with only two votes calling for steady rates, and Chairman Powell's comments ruling out rate hikes, are keeping investors confident that the bank will cut rates at least two more times next year, as reflected on the CME Group FedWatch tool.
- Beyond that, the market is also pricing the replacement of Jerome Powell by a more dovish Kevin Hassett at the end of his term in May. Hassett, the White House economic adviser, affirmed earlier this week that there is "plenty of room" to cut interest rates further.
- The Fed also announced a bond-buying program starting on December 12 with an initial round of $40 billion, aiming to support market liquidity, which took investors by surprise and added pressure on the USD.
- In Europe, the European Central Bank (ECB) President, Christine Lagarde, stuck to her usual rhetoric while talking at the Financial Times Global Boardroom Conference in London on Wednesday. She reiterated that the bank's monetary policy remains in good shape and suggested that ECB officials might lift the region's growth forecasts again, adding to evidence that the easing cycle has reached its end.
Technical Analysis: EUR/USD bulls are looking at 1.1730
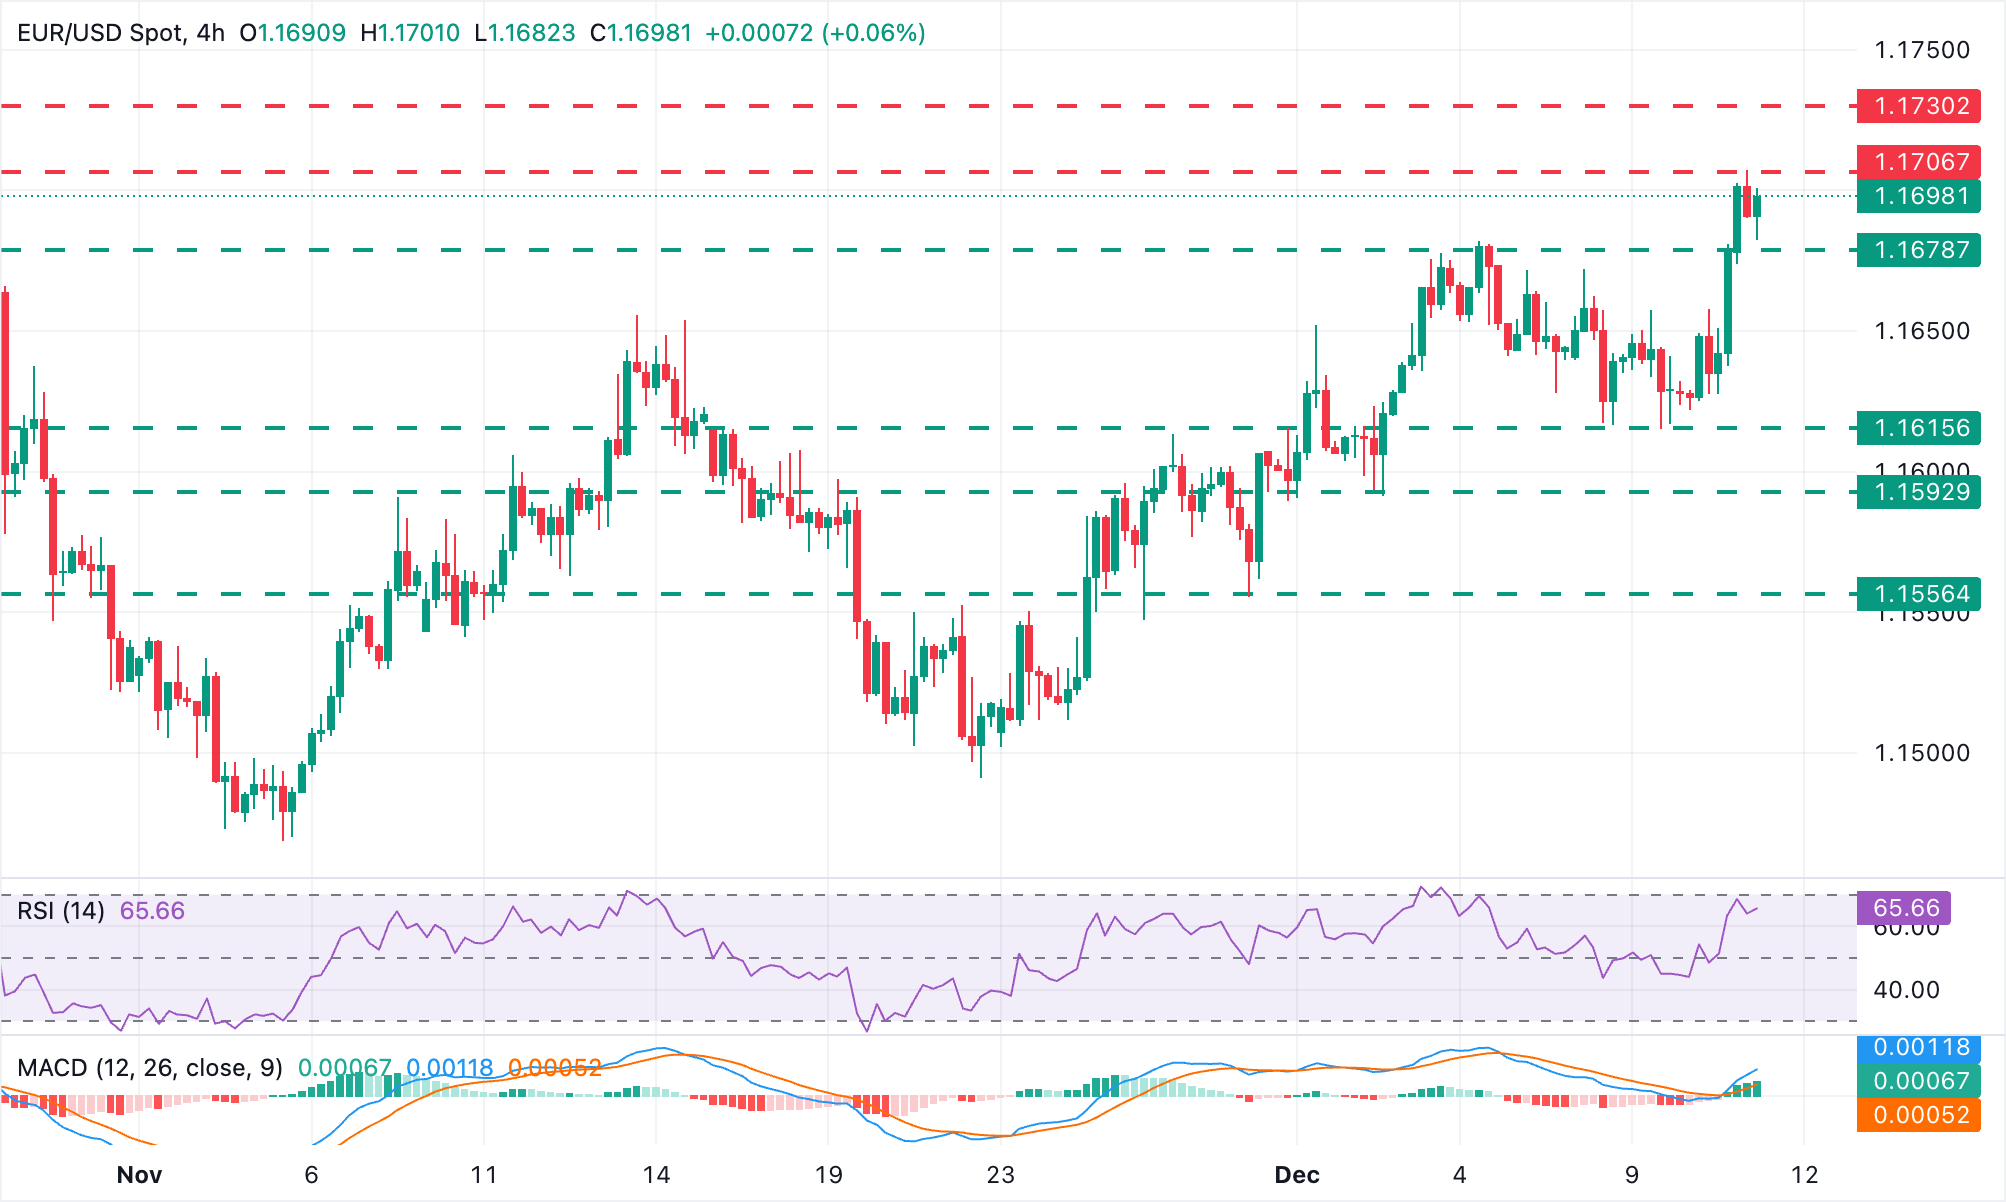
The EUR/USD technical picture has turned positive after breaking resistance at the 1.1680 area. The 4-hour Moving Average Convergence Divergence (MACD) is printing green bars, showing a strong bullish momentum, and the 4-hour Relative Strength Index (RSI) is in positive territory, still below overbought levels. In this context, and with the US Dollar Index depressed, further appreciation is on the cards.
The pair has confirmed above 1.1705, and bulls are now targeting the October 17 high, near 1.1730. The next target would be the October 1 high around 1.1780. On the downside, the December 4 high, near 1.1680, is providing support ahead of the December 9 low, at 1.1615, and the December 1 and 2 lows, around 1.1590.
Economic Indicator
Initial Jobless Claims
The Initial Jobless Claims released by the US Department of Labor is a measure of the number of people filing first-time claims for state unemployment insurance. A larger-than-expected number indicates weakness in the US labor market, reflects negatively on the US economy, and is negative for the US Dollar (USD). On the other hand, a decreasing number should be taken as bullish for the USD.
Read more.Next release: Thu Dec 11, 2025 13:30
Frequency: Weekly
Consensus: 220K
Previous: 191K
Source: US Department of Labor
Every Thursday, the US Department of Labor publishes the number of previous week’s initial claims for unemployment benefits in the US. Since this reading could be highly volatile, investors may pay closer attention to the four-week average. A downtrend is seen as a sign of an improving labour market and could have a positive impact on the USD’s performance against its rivals and vice versa.
Economic Indicator
Initial Jobless Claims 4-week average
This indicator measures the average number for the last four releases of the Initial Jobless Claims, which are released every Thursday. It is published by the US Department of Labor as a measure of the number of people filing first-time claims for state unemployment insurance. It provides a measure of strength in the labor market. An increasing trend in this number indicates weakness in this market which influences the strength and direction of the US economy. Generally speaking, a decreasing trend should be taken as bullish for the US Dollar (USD) while a higher reading should be taken as bearish.
Read more.Last release: Thu Dec 04, 2025 13:30
Frequency: Weekly
Actual: 214.75K
Consensus: -
Previous: 223.75K
Source: US Department of Labor
Author

Guillermo Alcala
FXStreet
Graduated in Communication Sciences at the Universidad del Pais Vasco and Universiteit van Amsterdam, Guillermo has been working as financial news editor and copywriter in diverse Forex-related firms, like FXStreet and Kantox.


![How Wall Street rigs the game [Video]](https://editorial.fxsstatic.com/images/i/market-chaos-01.jpg)