EUR/USD steadies near highs, awaiting US flash PMIs
- EUR/USD wavers below 1.1750 with the three-week highs, at 1.1768, still in sight.
- Eurozone January's flash HCOB PMIs have failed to impress.
- The US Dollar is on track for its largest weekly sell-off in months amid US-EU tensions.

EUR/USD posts moderate losses, trading right above 1.1730 at the time of writing on Friday, but holding most of the previous day's gains and on track for its strongest weekly performance since June. Eurozone's flash Purchasing Managers' Index (PMI) has failed to provide any significant support to the Euro (EUR), but the pair remains near multi-week highs, favoured by a weak US Dollar (USD), as the focus turns to the US S&P Global PMIs.
US President Trump's obsession with Greenland and the tense relations between the US and Europe attracted attention this week and sent the Greenback sharply lower across the board. Trump said on social media that he has secured total and permanent access to the Arctic island in a deal with the North Atlantic Treaty Organization (NATO), following a speech at the Davos World Economic Forum, where he backed off on the use of military action against NATO allies and withdrew threats of tariffs to the Eurozone countries.
On the macroeconomic front, US Q3 Gross Domestic Product (GDP) figures beat expectations on Thursday, weekly Initial Jobless Claims rose less than expected, and the Personal Consumption Expenditures (PCE) Price Index revealed higher inflationary pressures in November These figures endorse the US Federal Reserve's (Fed) view of steady interest rates, the US Dollar, however, remained depressed.
Euro Price Today
The table below shows the percentage change of Euro (EUR) against listed major currencies today. Euro was the strongest against the Swiss Franc.
| USD | EUR | GBP | JPY | CAD | AUD | NZD | CHF | |
|---|---|---|---|---|---|---|---|---|
| USD | 0.09% | -0.19% | -0.17% | -0.06% | -0.21% | 0.03% | 0.11% | |
| EUR | -0.09% | -0.28% | -0.26% | -0.15% | -0.30% | -0.06% | 0.01% | |
| GBP | 0.19% | 0.28% | 0.02% | 0.13% | -0.03% | 0.22% | 0.29% | |
| JPY | 0.17% | 0.26% | -0.02% | 0.13% | -0.04% | 0.20% | 0.28% | |
| CAD | 0.06% | 0.15% | -0.13% | -0.13% | -0.16% | 0.08% | 0.16% | |
| AUD | 0.21% | 0.30% | 0.03% | 0.04% | 0.16% | 0.25% | 0.32% | |
| NZD | -0.03% | 0.06% | -0.22% | -0.20% | -0.08% | -0.25% | 0.07% | |
| CHF | -0.11% | -0.01% | -0.29% | -0.28% | -0.16% | -0.32% | -0.07% |
The heat map shows percentage changes of major currencies against each other. The base currency is picked from the left column, while the quote currency is picked from the top row. For example, if you pick the Euro from the left column and move along the horizontal line to the US Dollar, the percentage change displayed in the box will represent EUR (base)/USD (quote).
Daily Digest Market Movers: EU-US tensions hit the US Dollar
- The US Dollar Index (DXY) languishes near three-week lows as the deterioration in the relationship between the US and the EU, its main trading partner, amid the Greenland issue erodes confidence in the US as a global leader and the status of the US Dollar as a reserve currency.
- Market sentiment improved after Trump softened his tone toward the European Union, which allowed for a relief rally. Transatlantic relations, however, have been severely damaged, and the US Dollar is taking the brunt of it, at least for now.
- Eurozone flash PMIs revealed that the Services sector expanded at a 51.6 pace in January, unchanged from December, against the 51.6 market consensus. The manufacturing PMI improved to 49.4 from 48.8 in December, bearing expectations of a 49.0 reading, yet still at contraction levels below 50.
- German PMIs, released earlier on Friday, came out better than expected. The services sector's activity improved to 53.3 from 52.7 in the previous month, above market expectations of a milder increase to 53.0. The Manufacturing PMI rose to 48.7 from 47.0, beyond the market expectations of a 48.0 reading, but also at levels indicating contraction.
- US macroeconomic data were USD-supportive on Thursday. The US Q3 GDP was revised up to 4.4% annualized growth, from the previous 4.3% estimate, and also above the 3.8% growth seen in Q2.
- The US PCE Price Index accelerated 2.8% year-on-year in November from 2.7% previously, as widely expected. The core PCE Price Index showed an identical performance.
- Beyond that, US Initial Jobless Claims rose to 200K in the week of January 17, from the upwardly revised 199K the previous week, still well below the 212K anticipated by the market.
- In the US, the S&P Global preliminary Services PMI is seen ticking up to 52.8 in January from 52.5 in December.
Technical Analysis: EUR/USD remains capped below resistance at the 1.1765 area
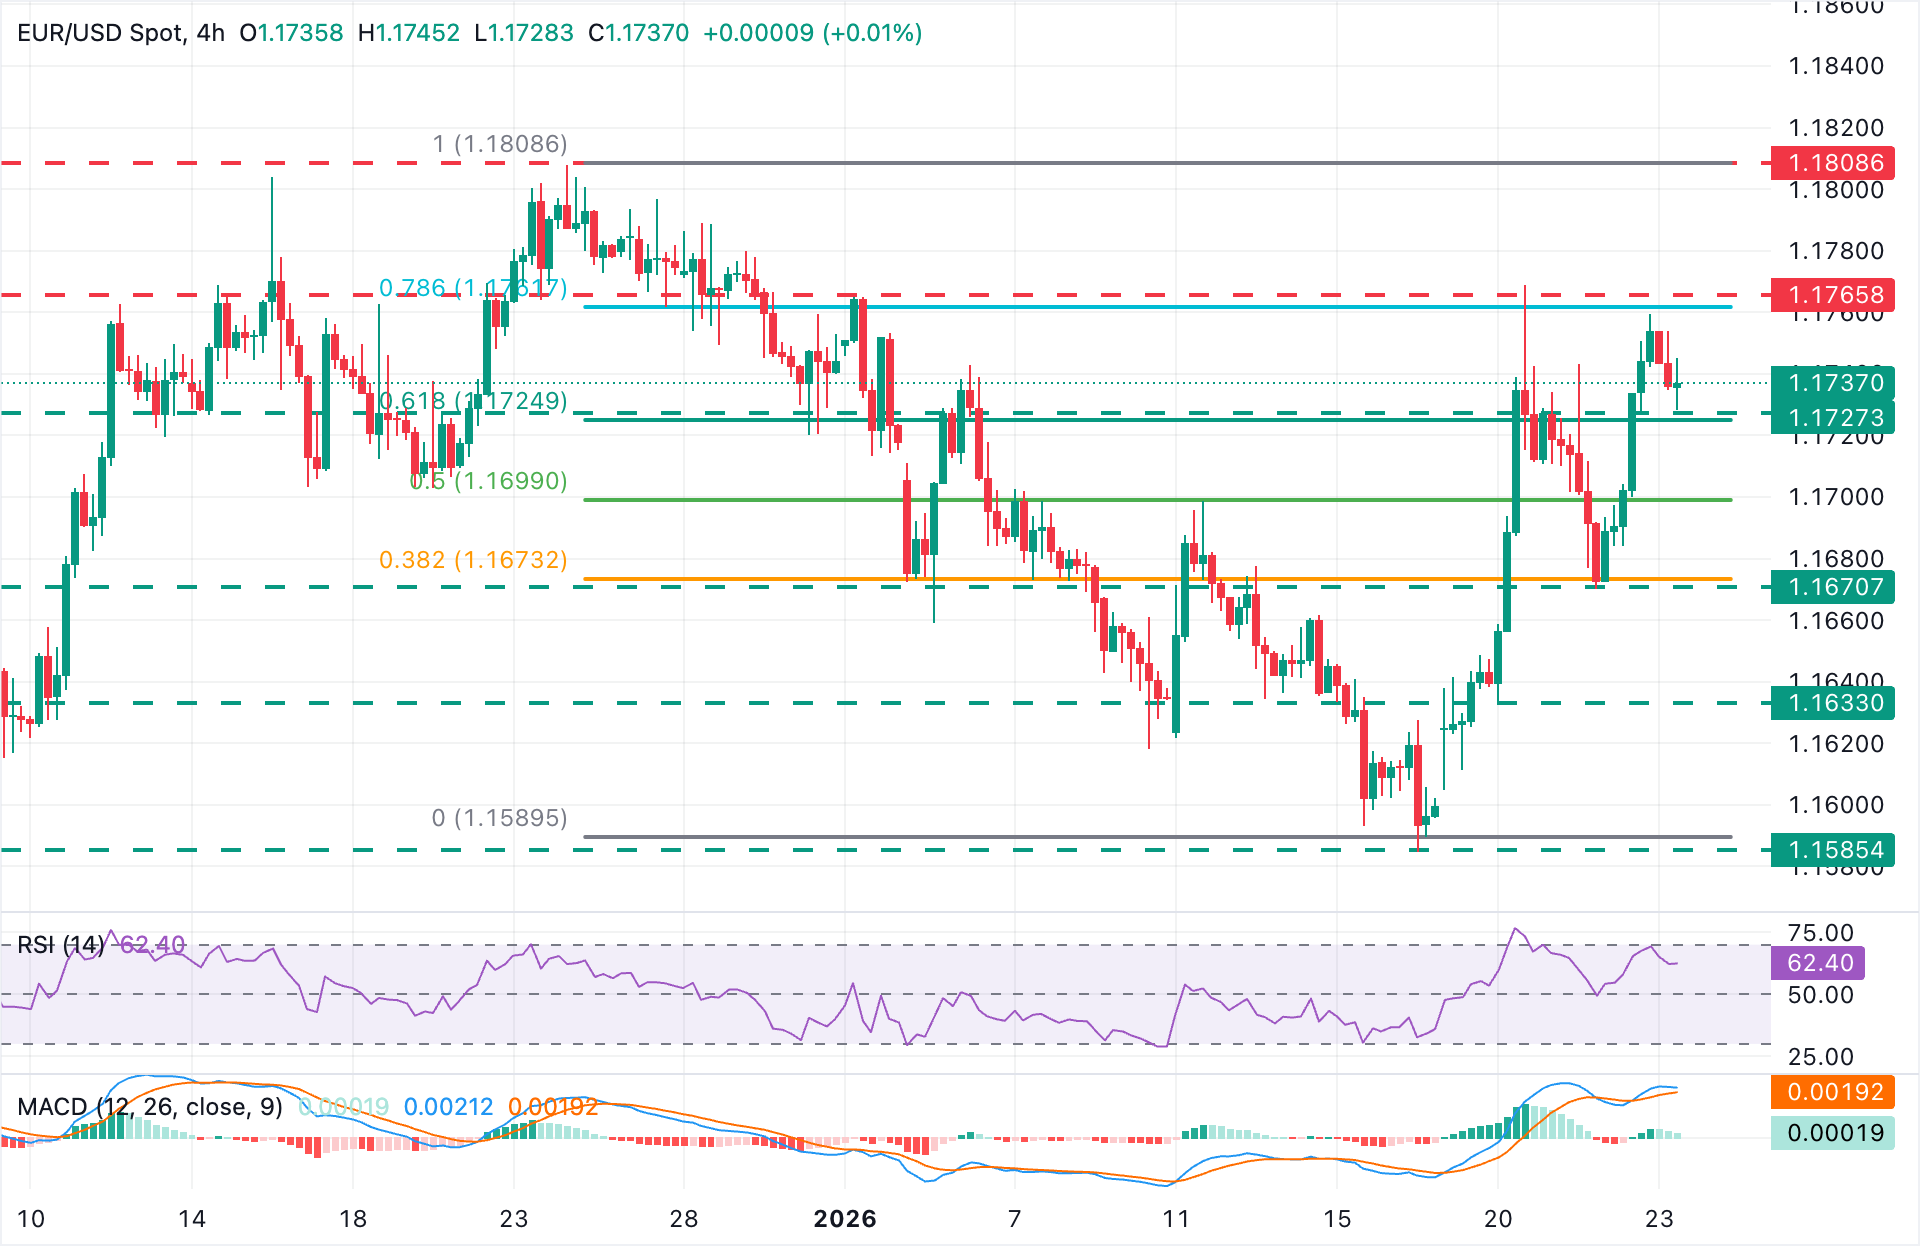
EUR/USD is consolidating between the 61.8% and the 72.6% Fibonacci retracement levels of the early January sell-off, keeping the pair's immediate bullish structure intact.
Technical indicators point to a mild positive trend. The Relative Strength Index (RSI) flatlined above 60, and the Moving Average Convergence Divergence (MACD) histogram is contracting but still positive, all in all hinting at a moderate bullish momentum.
On the downside, intraday lows are at the 1.1725 area, although there is no clear support ahead of Thursday's low at 1.1670. Above the mentioned 1.1765 (January 2 and 20 highs), the next target is the December 24 high, at 1.1808.
(The technical analysis of this story was written with the help of an AI tool.)
Economic Indicator
S&P Global Manufacturing PMI
The S&P Global Manufacturing Purchasing Managers Index (PMI), released on a monthly basis, is a leading indicator gauging business activity in the US manufacturing sector. The data is derived from surveys of senior executives at private-sector companies from the manufacturing sector. Survey responses reflect the change, if any, in the current month compared to the previous month and can anticipate changing trends in official data series such as Gross Domestic Product (GDP), industrial production, employment and inflation. A reading above 50 indicates that the manufacturing economy is generally expanding, a bullish sign for the US Dollar (USD). Meanwhile, a reading below 50 signals that activity in the manufacturing sector is generally declining, which is seen as bearish for USD.
Read more.Next release: Fri Jan 23, 2026 14:45 (Prel)
Frequency: Monthly
Consensus: 52.1
Previous: 51.8
Source: S&P Global
Economic Indicator
S&P Global Services PMI
The S&P Global Services Purchasing Managers Index (PMI), released on a monthly basis, is a leading indicator gauging business activity in the US services sector. As the services sector dominates a large part of the economy, the Services PMI is an important indicator gauging the state of overall economic conditions. The data is derived from surveys of senior executives at private-sector companies from the services sector. Survey responses reflect the change, if any, in the current month compared to the previous month and can anticipate changing trends in official data series such as Gross Domestic Product (GDP), industrial production, employment and inflation. A reading above 50 indicates that the services economy is generally expanding, a bullish sign for the US Dollar (USD). Meanwhile, a reading below 50 signals that activity among service providers is generally declining, which is seen as bearish for USD.
Read more.Next release: Fri Jan 23, 2026 14:45 (Prel)
Frequency: Monthly
Consensus: 52.8
Previous: 52.5
Source: S&P Global
Author

Guillermo Alcala
FXStreet
Graduated in Communication Sciences at the Universidad del Pais Vasco and Universiteit van Amsterdam, Guillermo has been working as financial news editor and copywriter in diverse Forex-related firms, like FXStreet and Kantox.


