|

EUR/MXN Price Prediction: Breaking out of top of Bull Flag pattern

  • EUR/MXN appears to be breaking out of the top of a Bull Flag price pattern. 
  • Such patterns signal the likelihood of more upside evolving. 

EUR/MXN is in a medium and long-term uptrend within which it appears to have completed a Bull Flag continuation pattern. These patterns are bullish and are composed of a steep rally, known as the “flagpole”, followed by a rectangular or square consolidation phase, called the “flag square”.  

EUR/MXN Daily Chart 

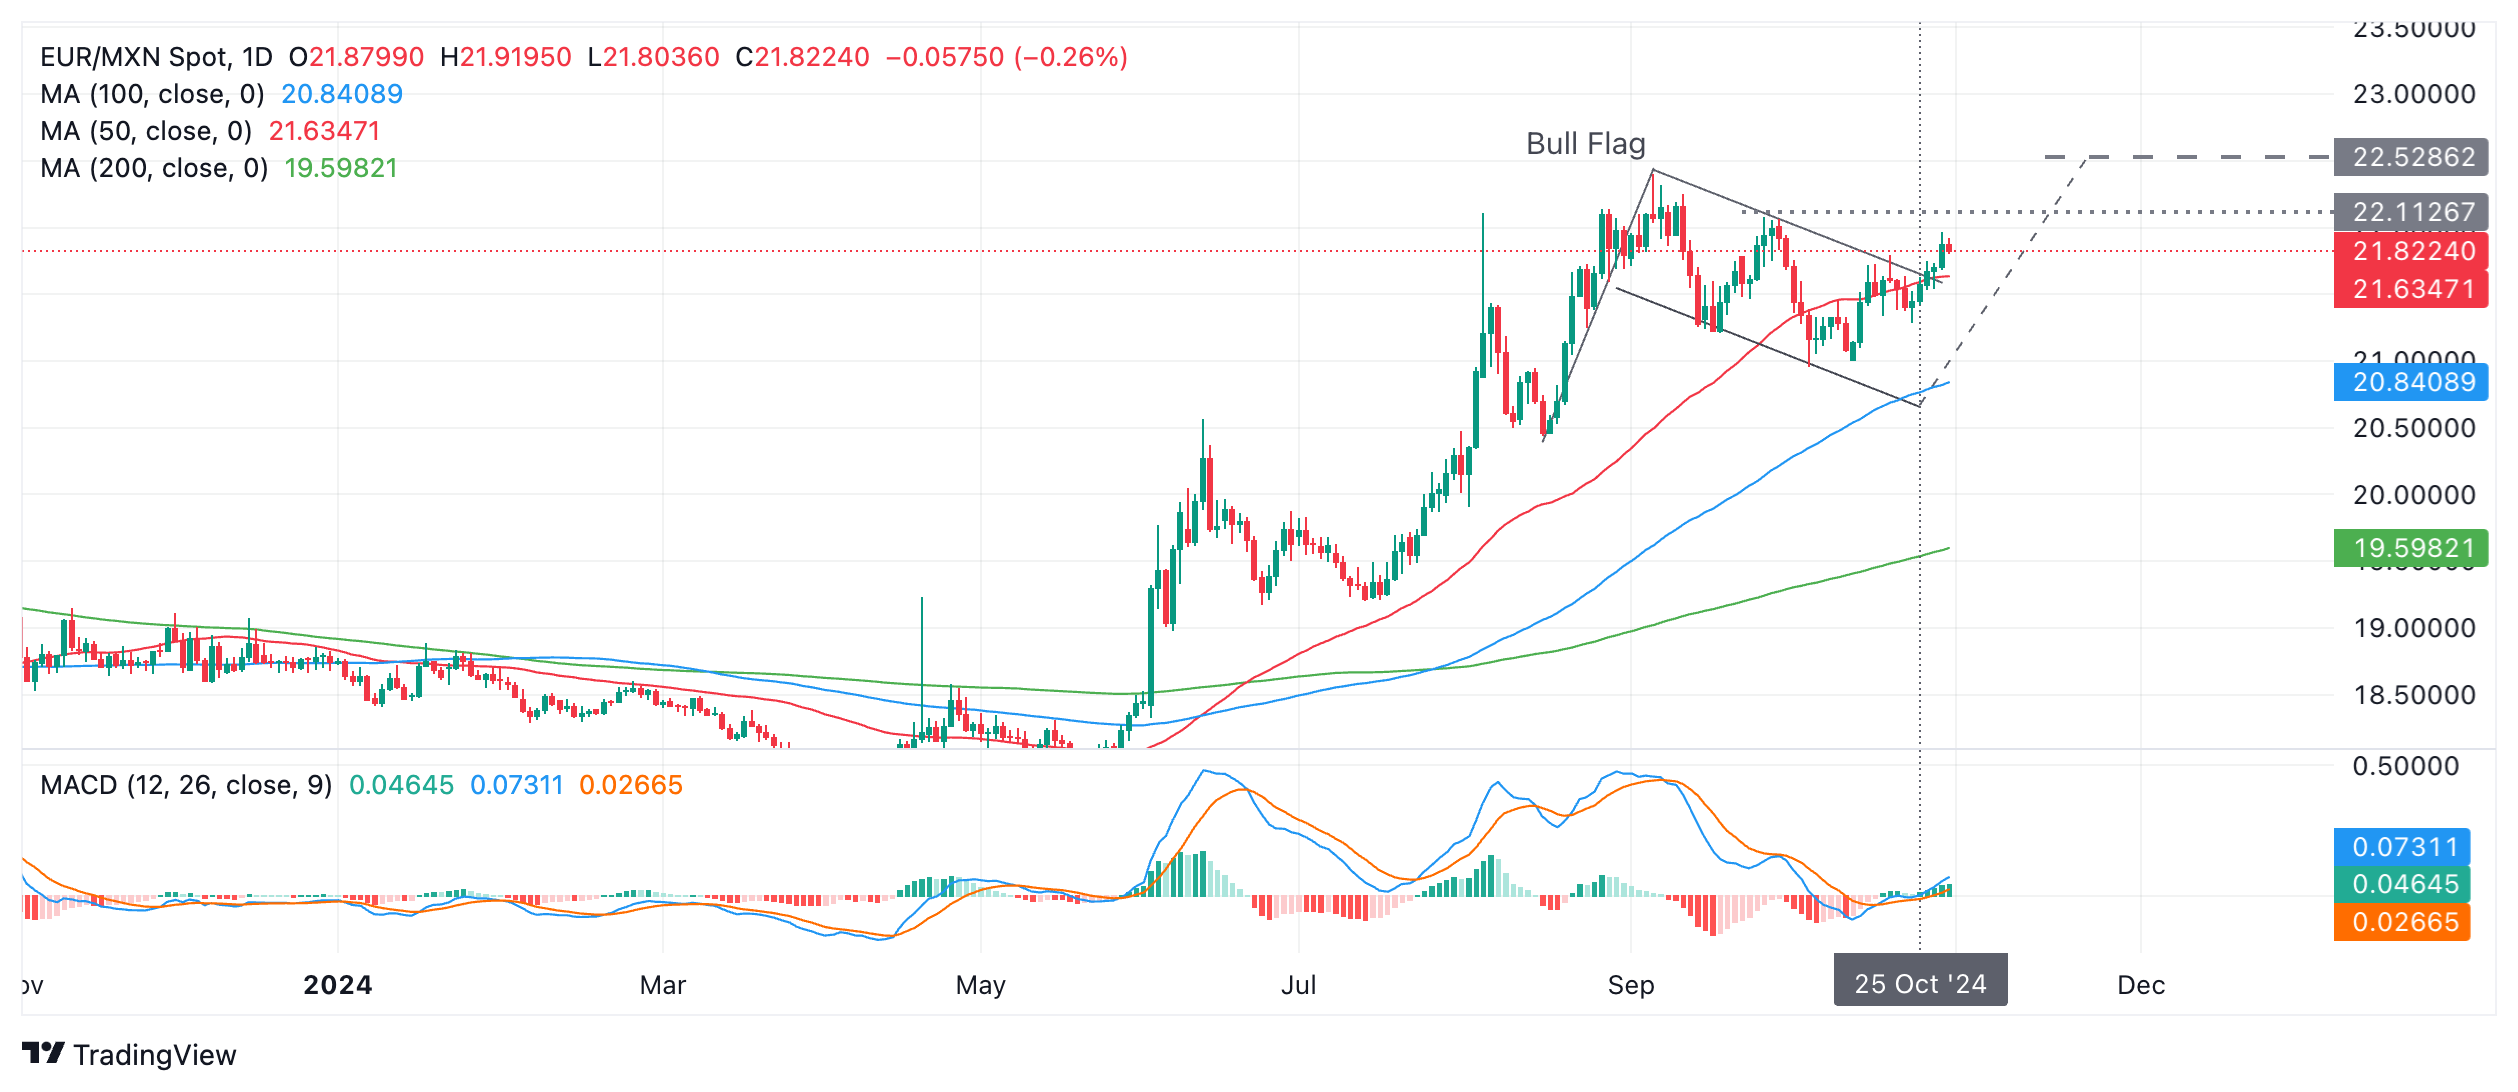
In the case of EUR/MXN the flagpole probably began life on August 15, leading to a rally up to a peak on September 5 before which price fell and began forming the flag square section. This now looks complete and the price is actually in the process of breaking out of the top of the flag – a sign it is about to start rallying higher again. 

A break above the 22.07 September 26 high would provide confirmation for the pattern and likely lead to a continuation up to a preliminary target at 22.40, the September 5 peak followed by 22.52 (flat gray dashed line on chart), the actual target calculated using the pattern. The target is calculated by extrapolating the length of the flagpole higher, in the usual method for forecasting these patterns. 

Author

Joaquin Monfort

Joaquin Monfort is a financial writer and analyst with over 10 years experience writing about financial markets and alt data. He holds a degree in Anthropology from London University and a Diploma in Technical analysis.

More from Joaquin Monfort
Share:

Markets move fast. We move first.

Orange Juice Newsletter brings you expert driven insights - not headlines. Every day on your inbox.

By subscribing you agree to our Terms and conditions.

Editor's Picks

EUR/USD declines toward 1.1700 on solid USD recovery

EUR/USD turns south and declines toward 1.1700 on Wednesday. A solid comeback staged by the US Dollar weighs heavily on the pair, as traders look to USD short covering ahead of US CPI on Thursday. However, the downside could be capped by hawkish ECB expectations. 

GBP/USD slides toward 1.3300 after softer-than-expected UK inflation data

GBP/USD has come under intense selling pressure, eyeing 1.3300 in the European session on Wednesday. The UK annual headline and core CPI rose by 3.2% each, missing estimates of 3.5% and 3.4%, respectively, reaffirming dovish BoE expectations and smashing the Pound Sterling across the board. 

Gold clings to modest gains above $4,300

Following Tuesday's volatile action, Gold regains its traction on Wednesday and trades in positive territory above $4,300. While the buildup in the USD recovery momentum caps XAU/USD's upside, the cautious market stance helps ithe pair hold its ground.

Bitcoin risks deeper correction as ETF outflows mount, derivative traders stay on the sidelines

Bitcoin (BTC) remains under pressure, trading below $87,000 on Wednesday, nearing a key support level. A decisive daily close below this zone could open the door to a deeper correction.

Monetary policy: Three central banks, three decisions, the same caution

While the Fed eased its monetary policy on 10 December for the third consecutive FOMC meeting, without making any guarantees about future action, the BoE, the ECB and the BoJ are holding their respective meetings this week. 

AAVE slips below $186 as bearish signals outweigh the SEC investigation closure

Aave (AAVE) price continues its decline, trading below $186 at the time of writing on Wednesday after a rejection at the key resistance zone. Derivatives positioning and momentum indicators suggest that bearish forces still dominate in the near term.