|

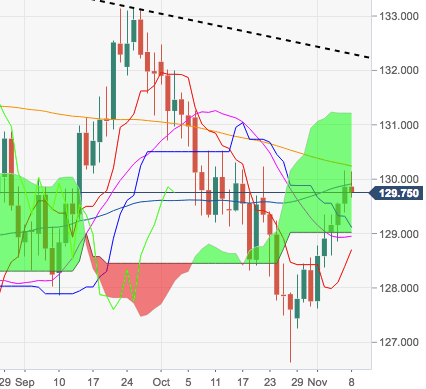
EUR/JPY Technical Analysis: Upside capped by the 200-day SMA at 130.21

  • The recovery in the cross met strong resistance in the boundaries of the key 200-day SMA at 130.2, provoking failure and the ongoing knee-jerk after five consecutive daily advances.
  • Immediate target on the upside remains the 200-day SMA at 130.21. A sustainable breakout of this area should pave the way for a visit to late-August peaks around 130.90.
  • In order to reassert the upside pressure, EUR/JPY needs to break above the resistance line off YTD tops, today at 132.29.

EUR/JPY daily chart
EUR/JPY

Overview:
    Last Price: 129.74
    Daily change: -12 pips
    Daily change: -0.0924%
    Daily Open: 129.86
Trends:
    Daily SMA20: 128.91
    Daily SMA50: 129.91
    Daily SMA100: 129.49
    Daily SMA200: 130.29
Levels:
    Daily High: 130.16
    Daily Low: 129.39
    Weekly High: 129.34
    Weekly Low: 127.24
    Monthly High: 132.49
    Monthly Low: 126.63
    Daily Fibonacci 38.2%: 129.87
    Daily Fibonacci 61.8%: 129.69
    Daily Pivot Point S1: 129.45
    Daily Pivot Point S2: 129.03
    Daily Pivot Point S3: 128.67
    Daily Pivot Point R1: 130.22
    Daily Pivot Point R2: 130.58
    Daily Pivot Point R3: 130.99

Author

Pablo Piovano

Born and bred in Argentina, Pablo has been carrying on with his passion for FX markets and trading since his first college years.


More from Pablo Piovano
Share:

Editor's Picks

GBP/USD turns negative; slips back to 1.3530

GBP/USD comes under pressure and weakens toward the 1.3530 zone on Tuesday. Cable thus leaves behind two daily upticks in a row and retreats further from Monday’s multi-week tops past 1.3570 following humble gains in the Greenback and disheartening UK jobs data.

EUR/USD comes under pressure near 1.1570

EUR/USD could not sustain the earlier bullish attempt toward the proximity of 1.1600 the figure, coming under fresh downside pressure and revisiting the 1.1580-1.1570 band as the NA session draws to a close on Tuesday. The better tone in the US Dollar in the latter part of the day weighs on the pair amid steady volatility in the Middle East. Looking forward, the release of the FOMC Minutes takes centre stage on Wednesday.

Gold consolidates below $4,350; looks to FOMC Minutes for fresh impetus

Gold holds steady below $4,350, following the previous day's heavy losses, as traders await the release of FOMC Minutes for cues about the Fed's future policy path. In the meantime, the recent surge in US bond yields, bolstered by inflation fears stemming from rising oil prices, supports the US Dollar amid the Middle East crisis and should cap the non-yielding bullion.

Ethereum: Investors remain on the sidelines

Ethereum continued its consolidation pattern over the past week with several key on-chain and derivatives metrics indicating traders remain hesitant to return to the market. The holdings across several wallet cohorts remained largely unchanged over the past week. Wallets holding 10K-100K ETH, also classified as whales, saw modest inflows of only 10K ETH.

WTI rises to near $85.00 amid escalating US-Iran tensions

West Texas Intermediate oil price extends its gains for the fourth consecutive day, trading around $84.80 per barrel during the Asian hours on Wednesday. Crude oil prices advance as ongoing geopolitical friction between the United States and Iran sustained market concerns over global supply.

Why is Crude Oil priced for a reopening the ships haven't made?
Fourteen vessels crossed the Strait of Hormuz on Tuesday. Before the war, the count ran near 120 a day. In the sessions since the waterway was publicly declared open, Brent has drifted back to $87 and West Texas Intermediate (WTI) to $81, both a little lower again on Wednesday, with daily momentum on each unwound from the top of its range in late July to the low twenties now.














