|

EUR/JPY Technical Analysis: Immediate target emerges at the 200-day SMA above 122.00

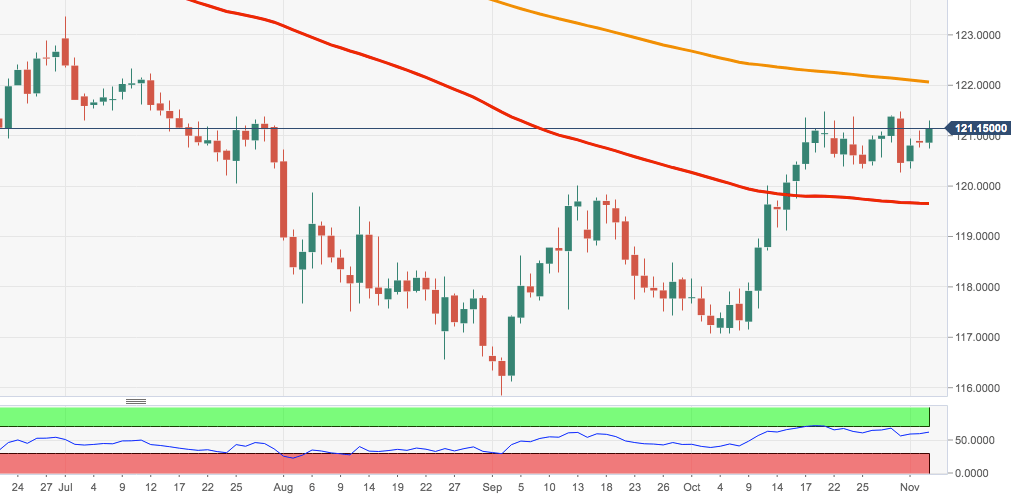
  • EUR/JPY is extending the weekly recovery to the area beyond the key hurdle at 121.00 the figure.
  • The next target on the upside emerges at the mid-121.00s, where sit October’s peaks. Further north is located the critical 200-day SMA just above 122.00 the figure.
  • On the other hand, the 120.30 region is expected to hold occasional bearish attempts. This area of contention is reinforced by the 21-day SMA at 120.12 ahead of the 100-day SMA at 119.65.

EUR/JPY daily chart

EUR/JPY

Overview
Today last price121.15
Today Daily Change54
Today Daily Change %0.24
Today daily open120.86
 
Trends
Daily SMA20120.24
Daily SMA50118.94
Daily SMA100119.66
Daily SMA200122.08
 
Levels
Previous Daily High121.11
Previous Daily Low120.76
Previous Weekly High121.48
Previous Weekly Low120.28
Previous Monthly High121.48
Previous Monthly Low117.07
Daily Fibonacci 38.2%120.89
Daily Fibonacci 61.8%120.98
Daily Pivot Point S1120.71
Daily Pivot Point S2120.56
Daily Pivot Point S3120.36
Daily Pivot Point R1121.06
Daily Pivot Point R2121.26
Daily Pivot Point R3121.41

Author

Pablo Piovano

Born and bred in Argentina, Pablo has been carrying on with his passion for FX markets and trading since his first college years.

More from Pablo Piovano
Share:

Editor's Picks

EUR/USD stays bid near 1.1560, focus shifts to the ECB

EUR/USD extends its weekly recovery for the third day in a row on Wednesday, navigating in a sidelined fashion around 1.1560 on the back of decent losses in the US Dollar. In the meantime, market participants continue to assess the latest US inflation data while hifting its attention to the ECB event on Thursday.

GBP/USD recedes from tops, hovers around 1.3400

GBP/USD could not sustain the initial bull run and is now slipping back toward the 1.3400 neighbourhood on Wednesday. Cable’s continuation of the ongoing leg higher follows mild selling pressure on the Greenback, despite steady uncertainty on the geopolitical front and elevated US inflation.

Gold threatens a test of YTD lows near $4,100

Gold is accelerating its downward trends and approaches the area of $4,100 per troy ounce on Wednesday, where the 2026 bottom sits so far. The persistent decline in the precious metal almost exclusively follows the swelling opinion that the Fed will keep a cautious stance in H2, a view that was reinforced following earlier US CPI data.

Crypto Today: Bitcoin, Ethereum, XRP face downside pressure amid investor de-risking

Major crypto assets trade under intense headwinds on Wednesday, as market participants navigate complex geopolitical and macroeconomic environments.

Brutal sell-off: Silver deepens months-long slide, refocusing on $60

Silver has never been known for its calm temperament. The precious metal can spend weeks grinding higher before suddenly giving back months of gains in a matter of days. That volatile reputation has been on full display in recent weeks.

The US economy defies the rules: 100 days into the Oil shock and the recession signal is still missing

More than three months after the start of the Iran war and the resulting disruption to global energy markets, the US economy continues to display remarkable resilience. The conflict has triggered a sharp rise in Oil prices, reignited inflationary pressures and fueled widespread concerns about a potential economic slowdown.